First Launch and User Interface Tour
Welcome to your Machinechat JEDI! Let's get familiar with the user interface so you can start harnessing the power of your real-time data.
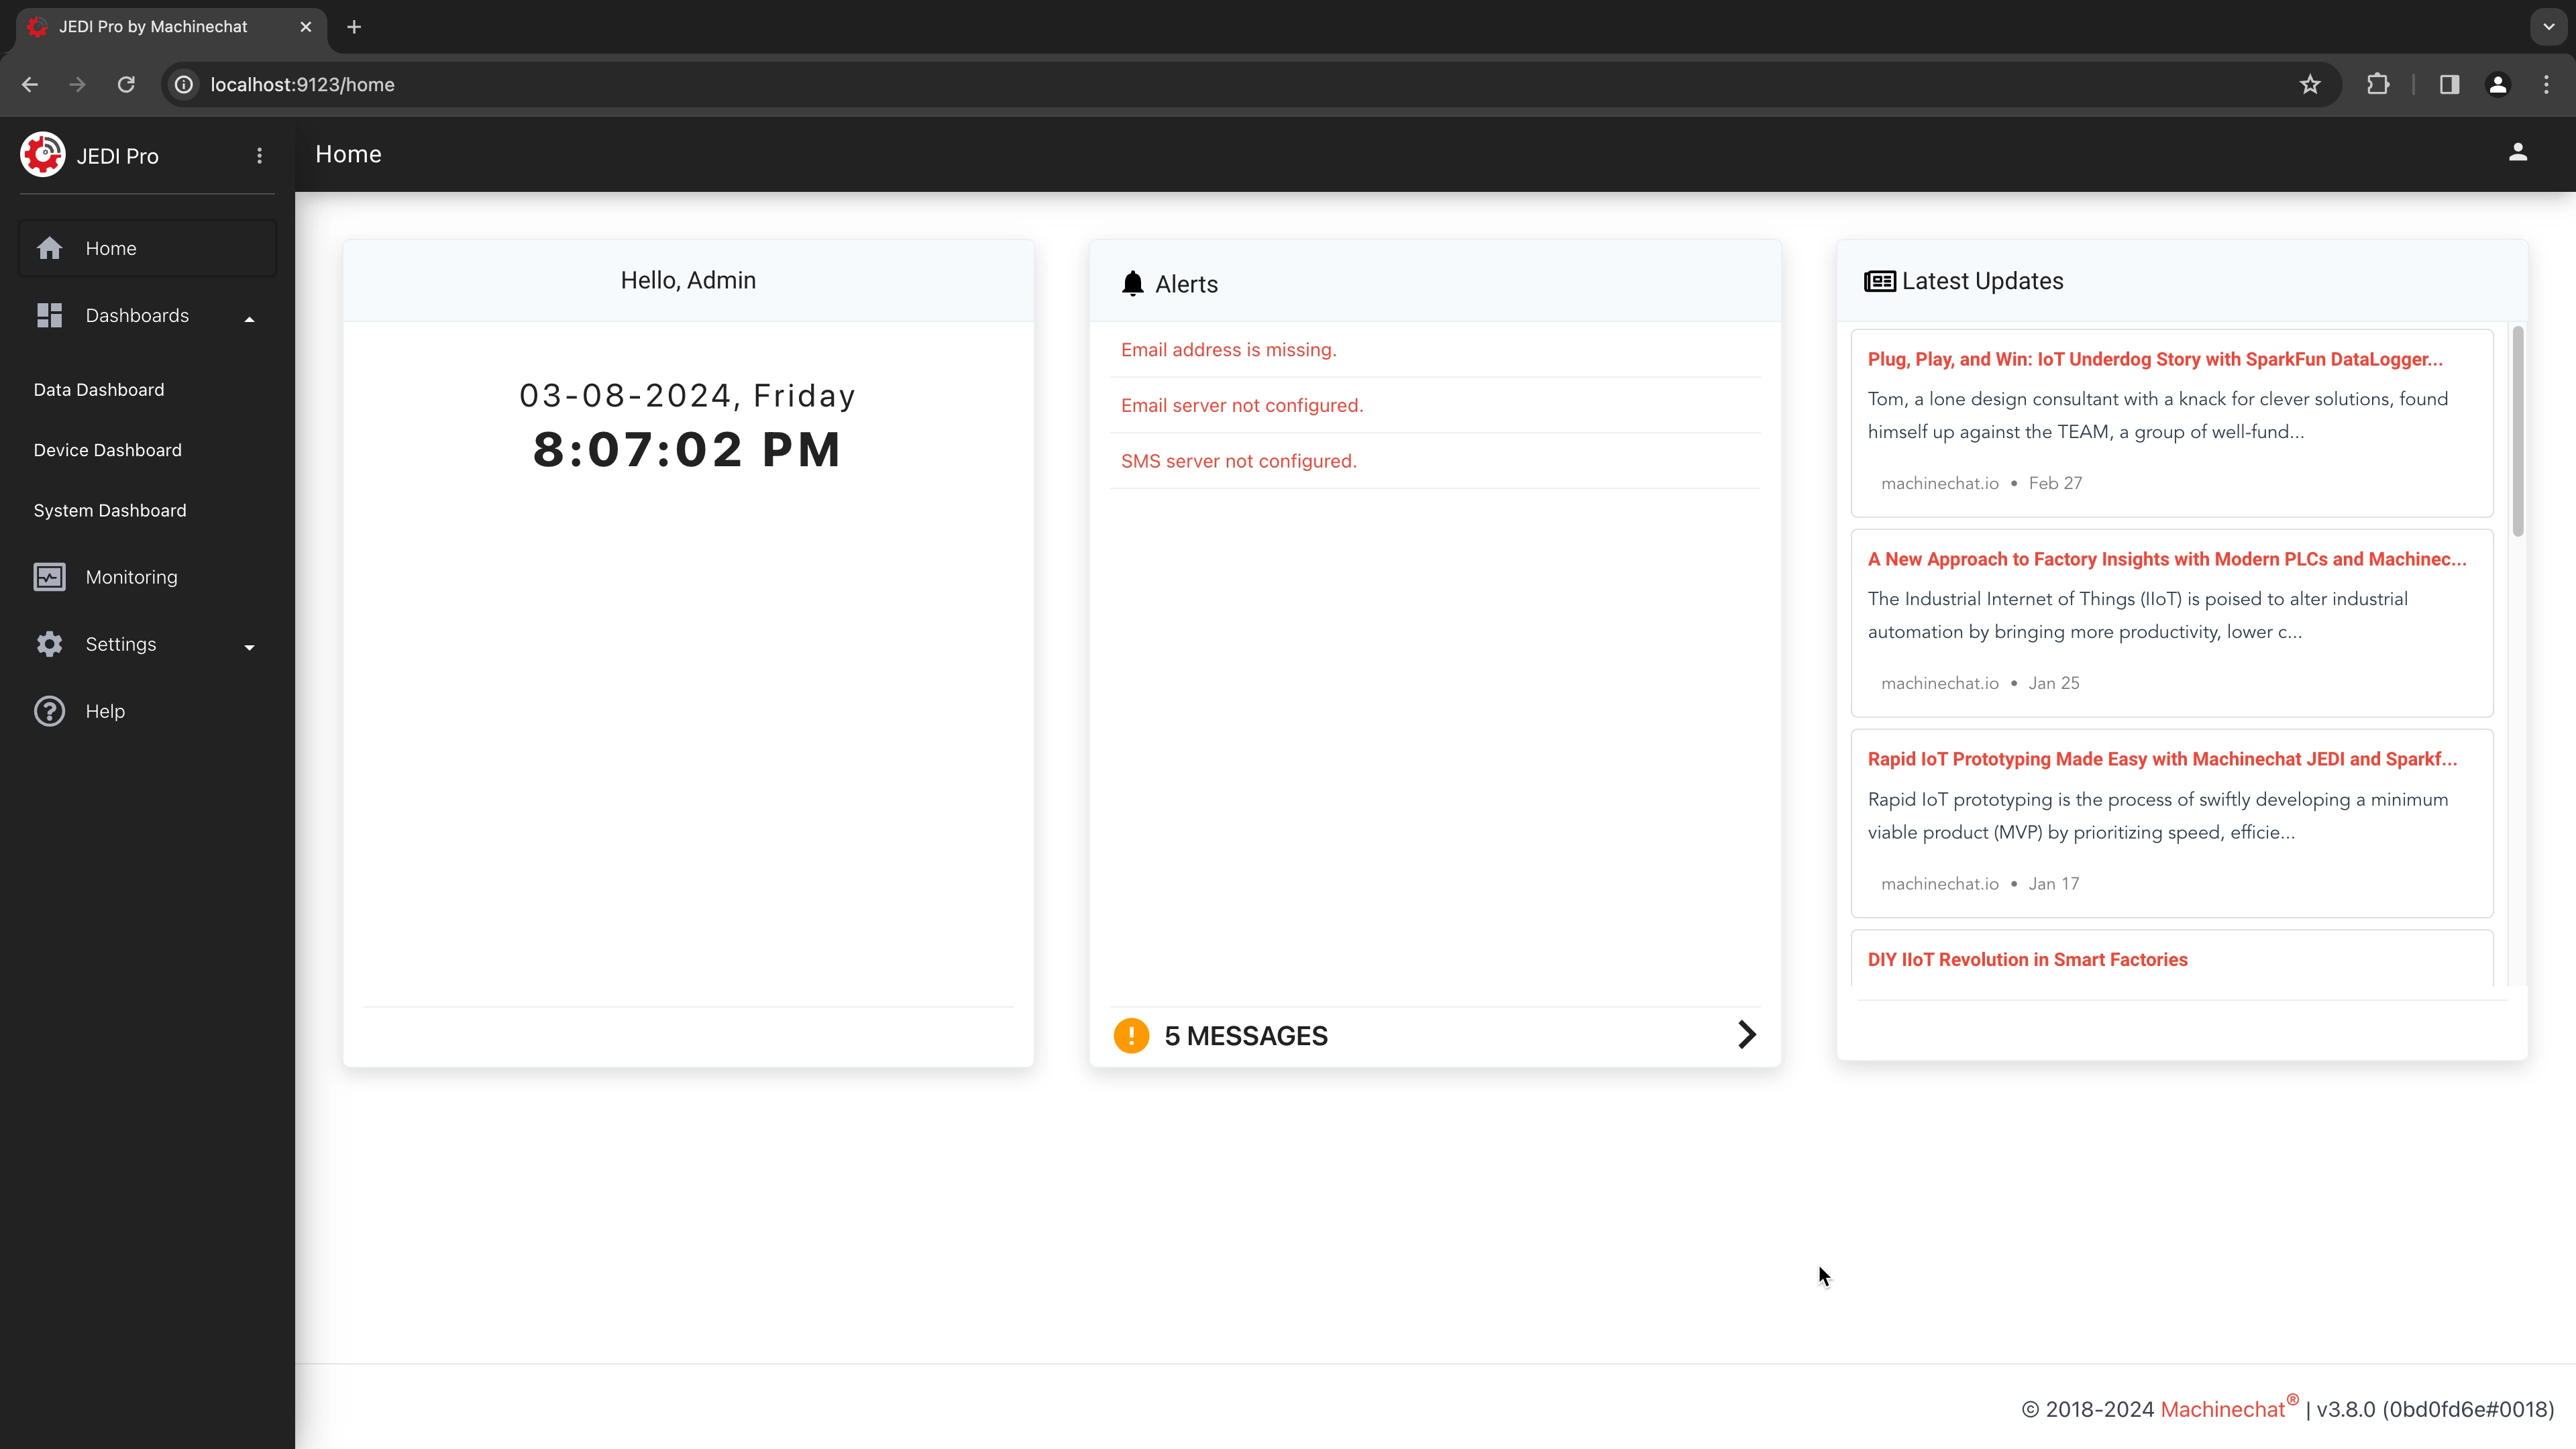
Overview
JEDI's interface is designed for clarity and ease of use. Here's a breakdown of the main sections:
-
Navigation Panel: This is your primary way to access different areas of JEDI.
-
Information Area: This displays important user details, system messages, and the Machinechat blog.
-
Status Bar: Where you'll find the JEDI version and build number.
Navigation Panel Deep Dive

Let's look at each item in the navigation panel:
-
JEDI Logo and Edition: Displays the JEDI logo and the edition you're currently using.
-
Home: Returns you to the main Home screen.
-
Dashboards
-
Data Dashboard: A customizable grid-based dashboard for displaying charts and control widgets.
-
Device Dashboard: Shows all configured devices and their incoming data in real time. This is an excellent troubleshooting tool.
-
System Dashboard: A unique canvas for creating process flow or HMI-style dashboards. You can overlay real-time data widgets on an image of your choice.
-
-
Monitoring: Keep tabs on your network with JEDI's device monitoring. Configure JEDI to periodically ping devices and alert you if they become unresponsive.
-
Settings
-
Data Collectors: Add and configure data collectors to connect with diverse sensors, devices, and machines.
-
Dashboard Manager: Create new dashboards, customize existing ones, and organize them for easy access.
-
Rules: Set up powerful rules to trigger actions based on real-time data conditions – get the alerts you need, when you need them.
-
Application: Configure core JEDI settings, including TLS for secure communications.
-
Users (JEDI Pro): Add and manage multiple users.
-
Notifications: Set up email and SMS notifications so you're always aware of critical events.
-
Data Storage: Choose which data to log and set retention policies to manage data storage.
-
Diagnostics: Gain insights into potential issues with error and warning indicators.
-
License: Manage your JEDI licenses, unlocking additional functionality and features.
-
Get Started:
Now that you've got the layout down, here are some things to try first:
-
Create a Dashboard: Experiment with the charts and widgets under the "Data Dashboards" section.
-
Add a Data Collector: Start bringing in data from your sensors or devices using a built-in data collector.
-
Set Up a Rule and Notification: Make sure you get alerted when something important happens!
Need help? Contact our support team: support@machinechat.io