Transform Key Metrics with JEDI's Dynamic Tile Chart
A Tile Chart is a simple and versatile visualization used to display a single metric value in a compact, easy-to-read format. It is ideal for quickly viewing the current state of a metric, whether it’s a numeric, Boolean, or string value.
Tile charts are commonly used for status indicators, summary values, and key metrics that need to be monitored at a glance.
Key Features
-
Supports multiple data types
Works with numeric, boolean, and string metrics
-
Real-time value display
Shows the latest value of a selected metric
-
Threshold-based customization
Apply color changes or visual cues based on value ranges
-
Flexible formatting
Customize how values and labels are displayed
-
Compact design
Ideal for dashboards with multiple key indicators
Configuration
Tile Chart for Grid Dashboard
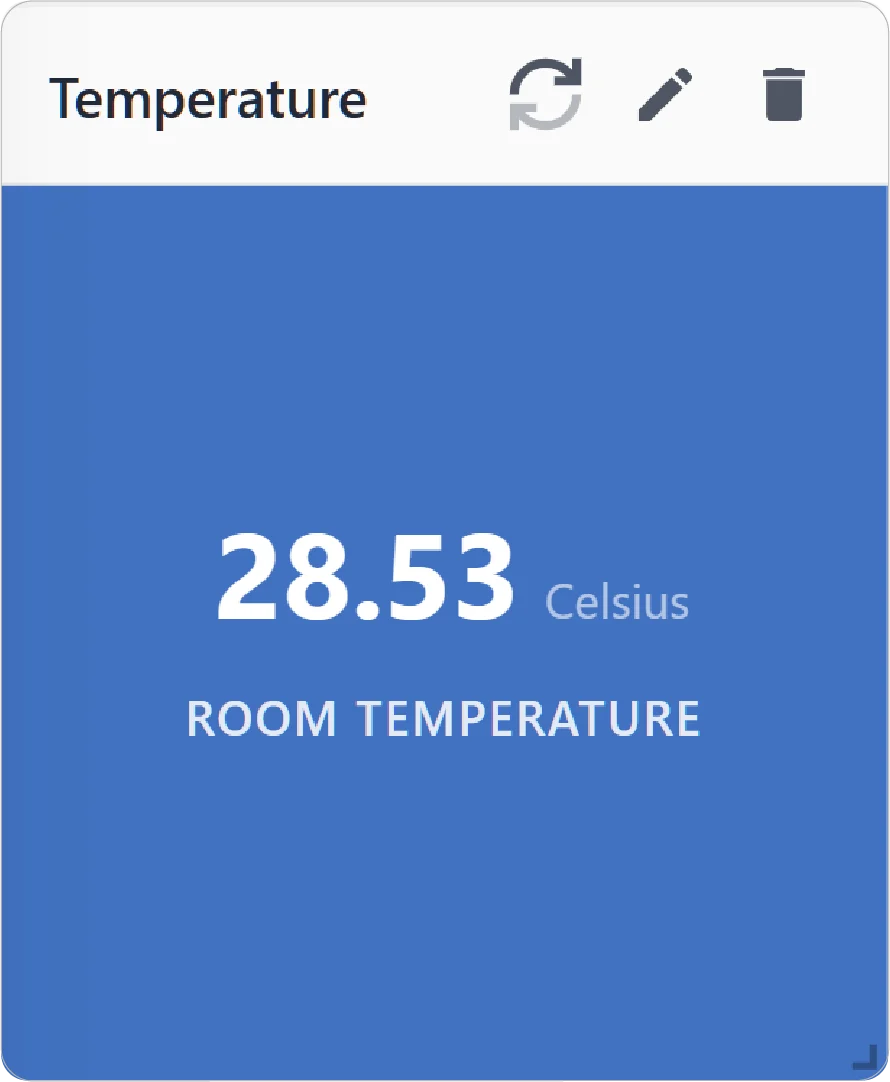
Configuration Options
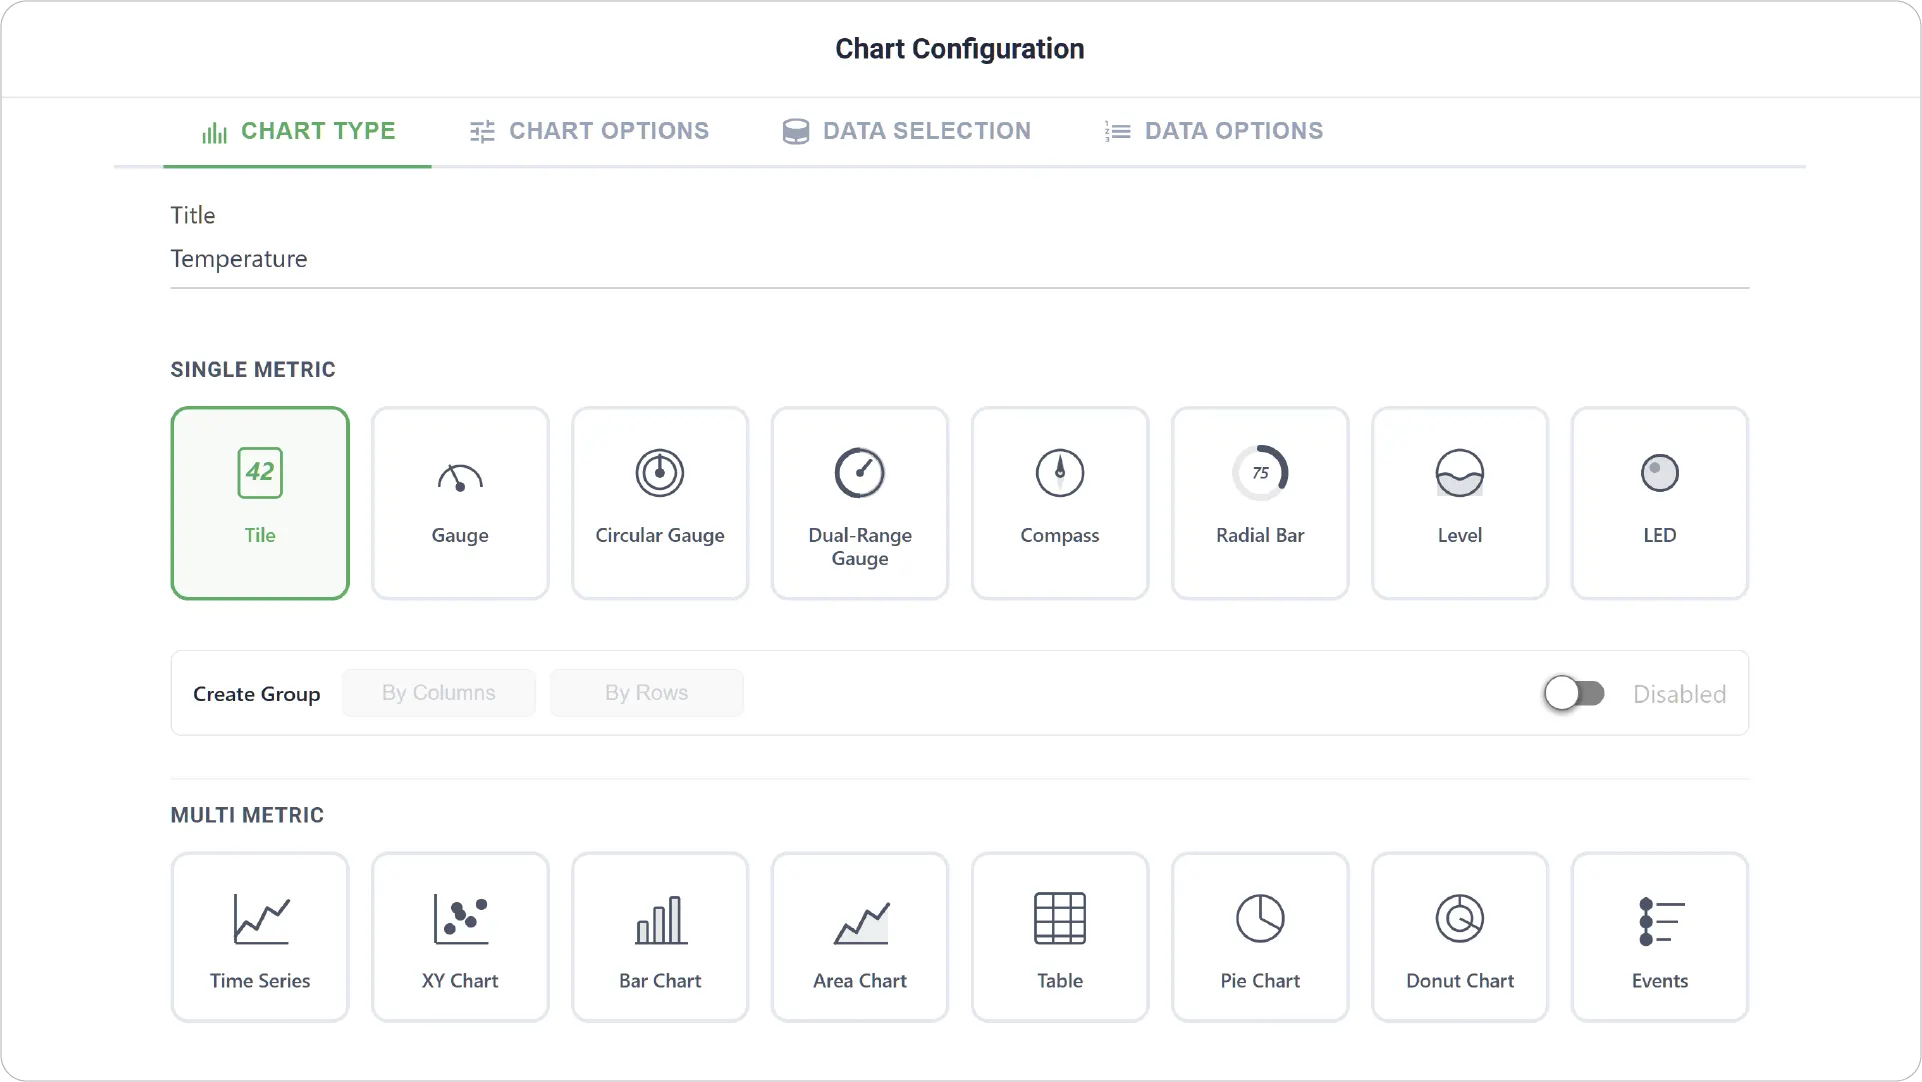
- Chart Type: Select the Tile Chart type and provide a title for your chart.
- Enabling Create Group allows you to add more than one Tile Chart.
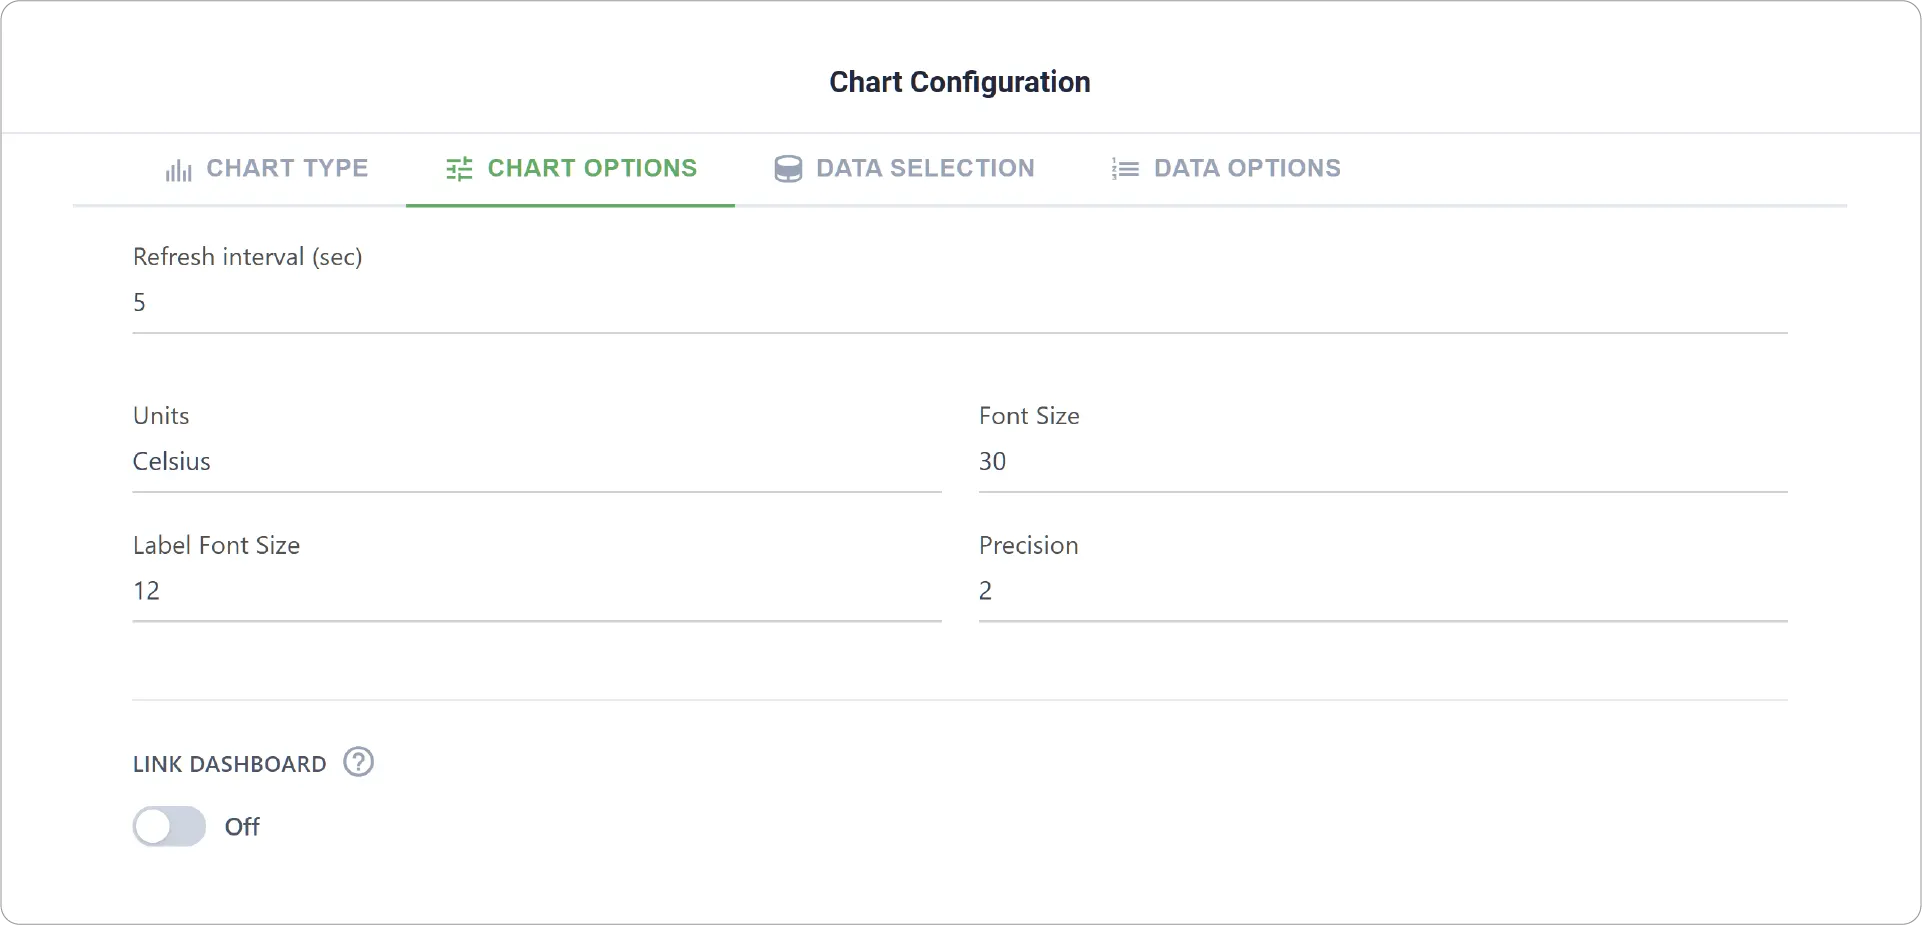
- Chart Options: Configure visual elements such as font size, units for numeric values, and other display settings.
- Create Group Settings: Available when Create Group is enabled. Set Label Font Size for each grouped Tile Chart.
- Link Dashboard: Enable to link this chart to another dashboard.
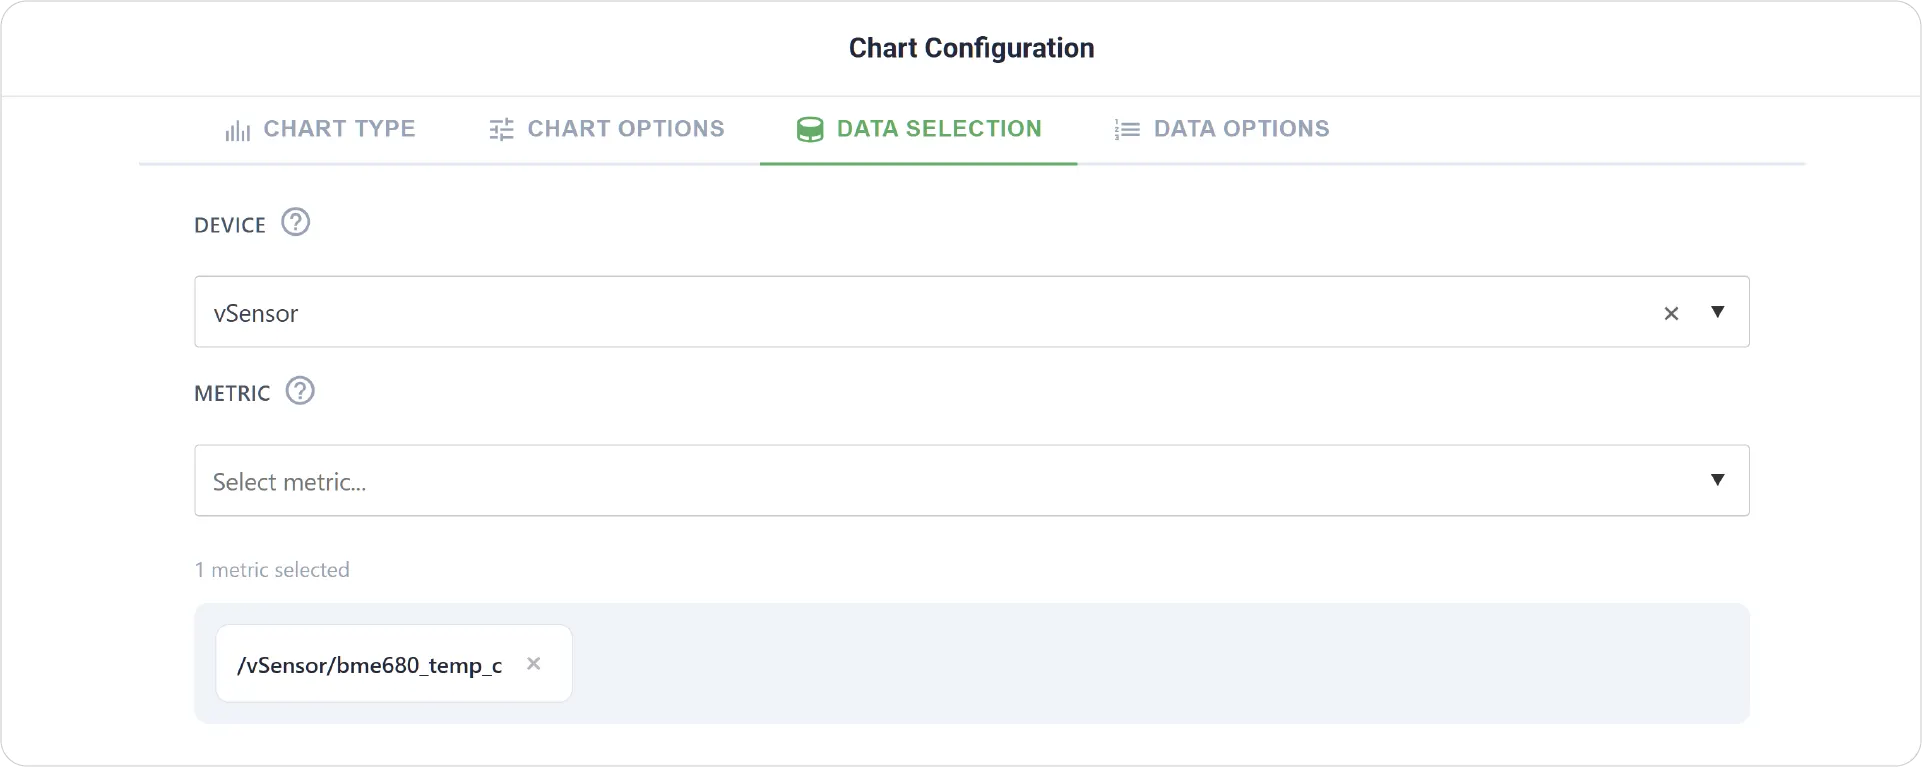
- Data Selection: Choose the device and select the metric you want to display in the tile chart.
- Add Item: Available when grouping is enabled, allowing addition of multiple Tile Charts along with Min-Max Values, Units, Fill Color, and Threshold settings for each Metric.
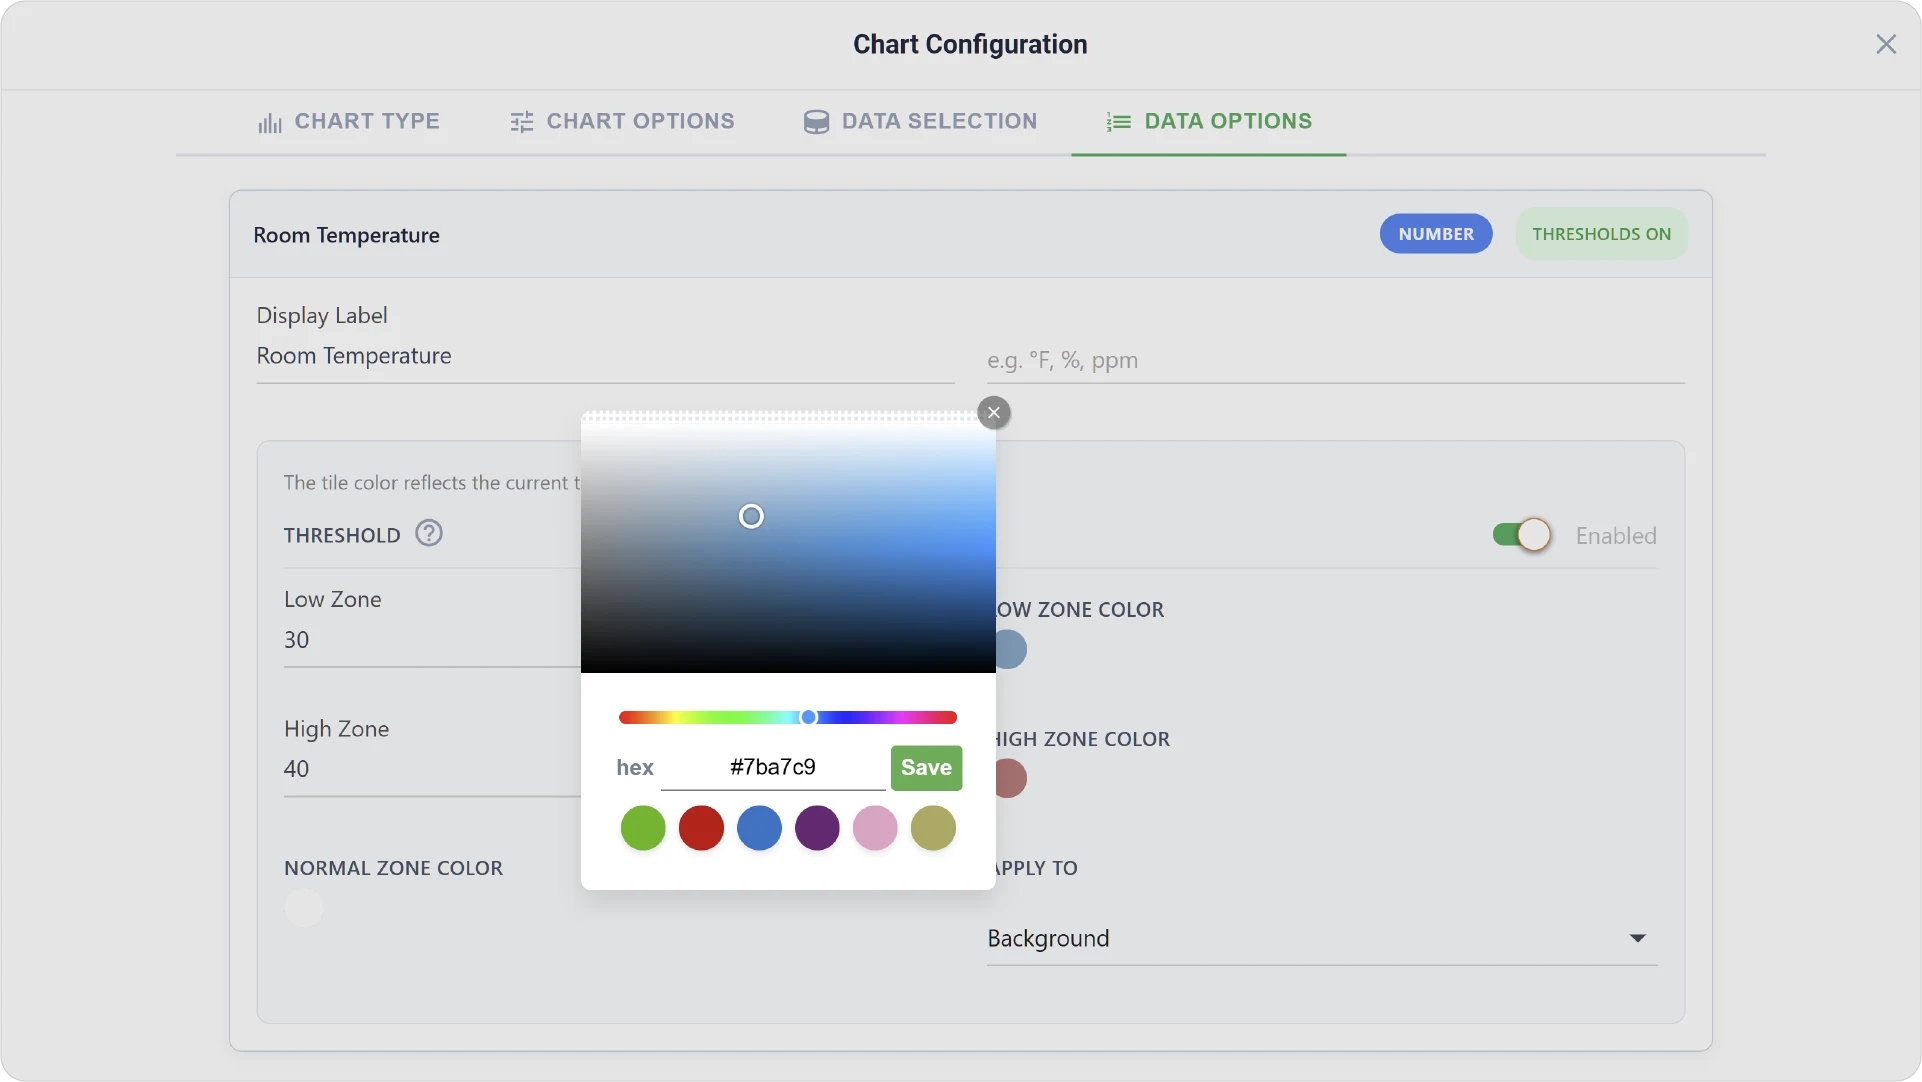
- Data Options: Customize how the data is presented, including display labels, as well as configuring thresholds (e.g., defining value ranges and applying colors based on those ranges).
- Data Options are not available when Create Group is enabled.
Real-World Use Cases
-
Device Status Monitoring
Display whether a device is online/offline or on/off using boolean values.
-
Environmental Readings
Show real-time values such as temperature, humidity, or pressure in a clear, compact format.
-
Operational State Display
Present string-based states like Mode (Auto/Manual) or System Status (Idle/Running/Error).
Ready to elevate your dashboards with the Tile Chart? Explore our other Grid Dashboard chart guides!
Need help?
Contact our support team: support@machinechat.io