Dashboards Overview
JEDI's dashbaords provide real-time situational awareness by transforming IoT data into clear, intuitive visualizations of your connected devices and sensors. They help you derive insights, identify trends, and make data-driven decisions with confidence.
Key Features
- Clean and Intuitive Interface: JEDI dashboards are designed with usability in mind, offering a streamlined interface that makes it easy to build and interpret visualizations without complexity.
- Rich Visualization Library: Leverage a wide range of visualization options, including gauges, charts, tables, and other widgets to represent your IoT data in meaningful ways.
- Device and Metric Selection: Select the specific devices and metrics you need to focus on the data that matters most.
- Historical Data Visualization: Analyze trends over time by visualizing historical data through custom chart settings for deeper insights.
- Multiple Dashboard Types:
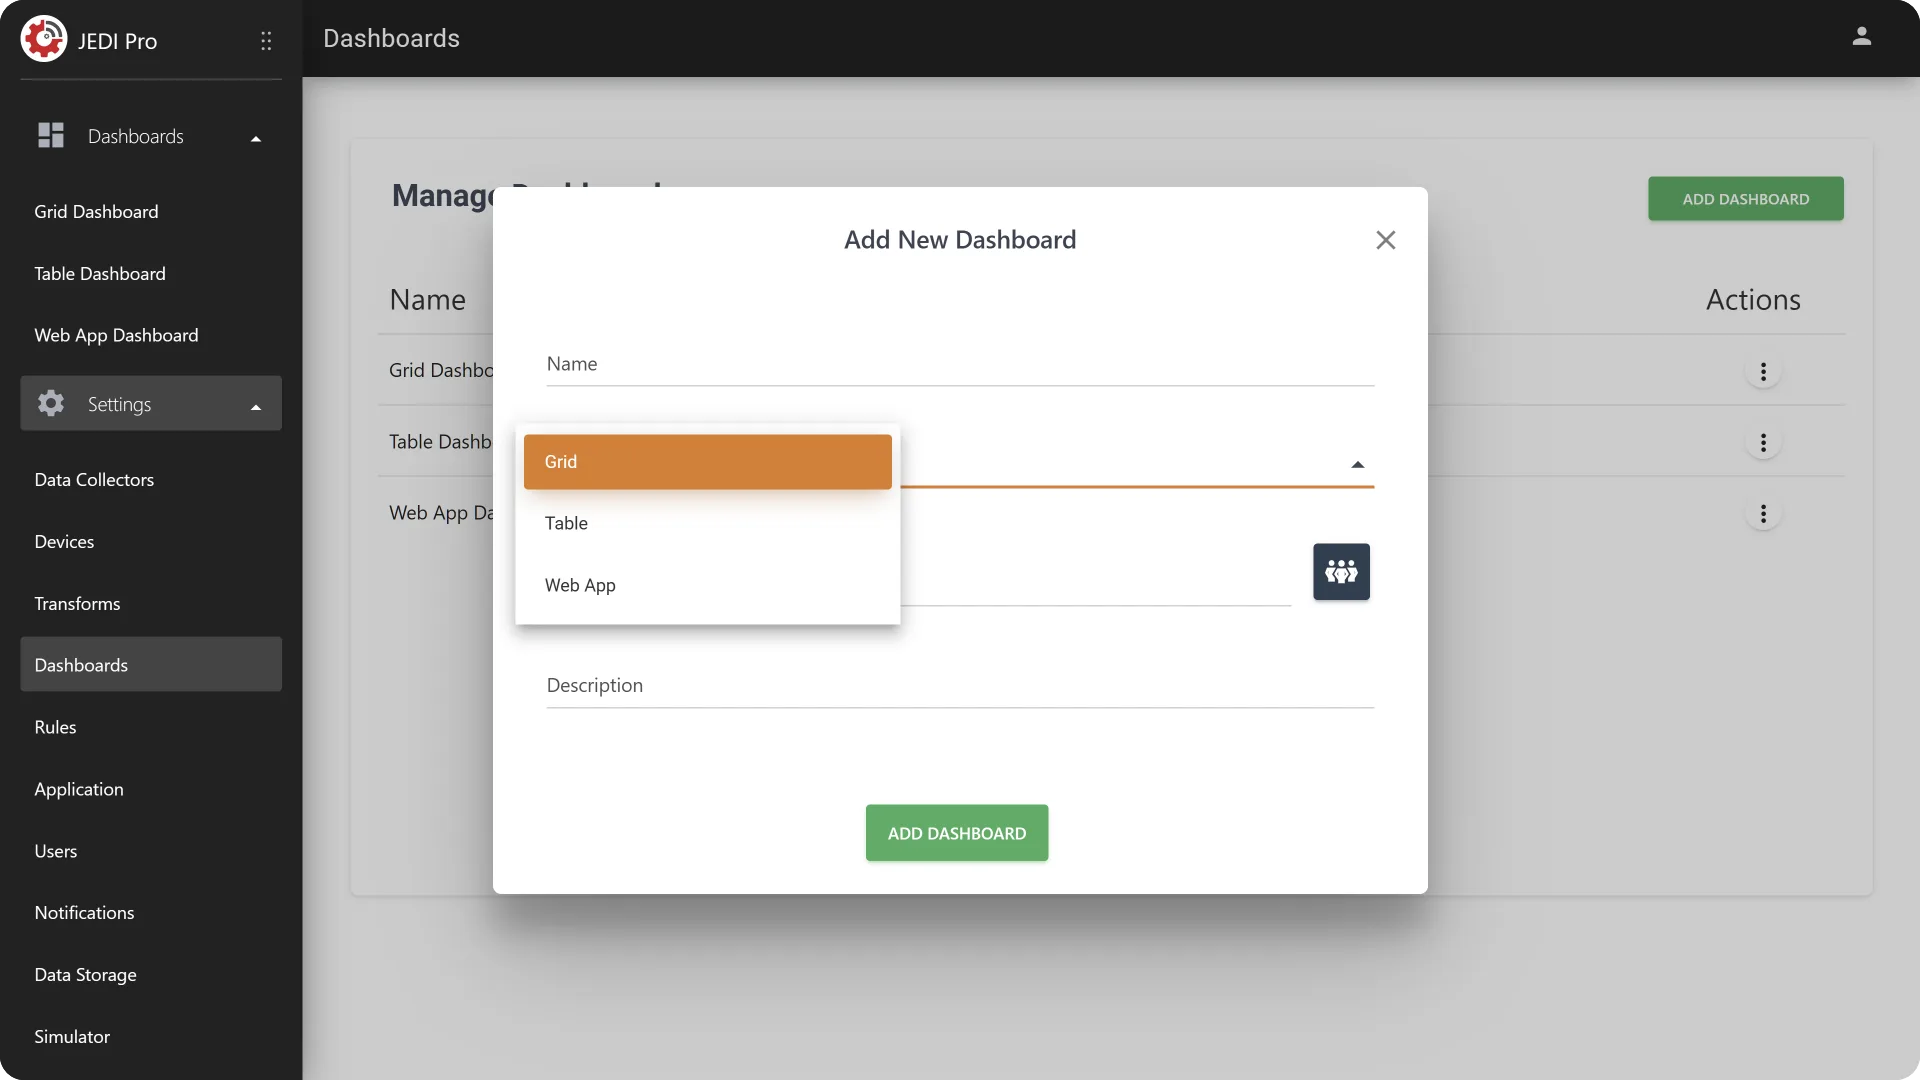
- Grid Dashboard: A flexible, drag-and-drop layout that allows you to arrange charts freely and build fully customized visualizations.
- Table Dashboard: Displays data in structured table formats, ideal for comparing multiple metrics or viewing detailed data records.
- Web App Dashboard: Enables integration of web-based applications into dashboards for extended functionality and external access.
- Interactive Exploration: Interact with your data using controls such as Toggle, Slider, and Text Input.
Create and Manage Dashboards
Machinechat JEDI makes it easy to create and organize dashboards to suit your workflow. You can build new dashboards from scratch, customize layouts, add or remove charts, and modify data sources as your needs evolve.
Switch Between Multiple Dashboards
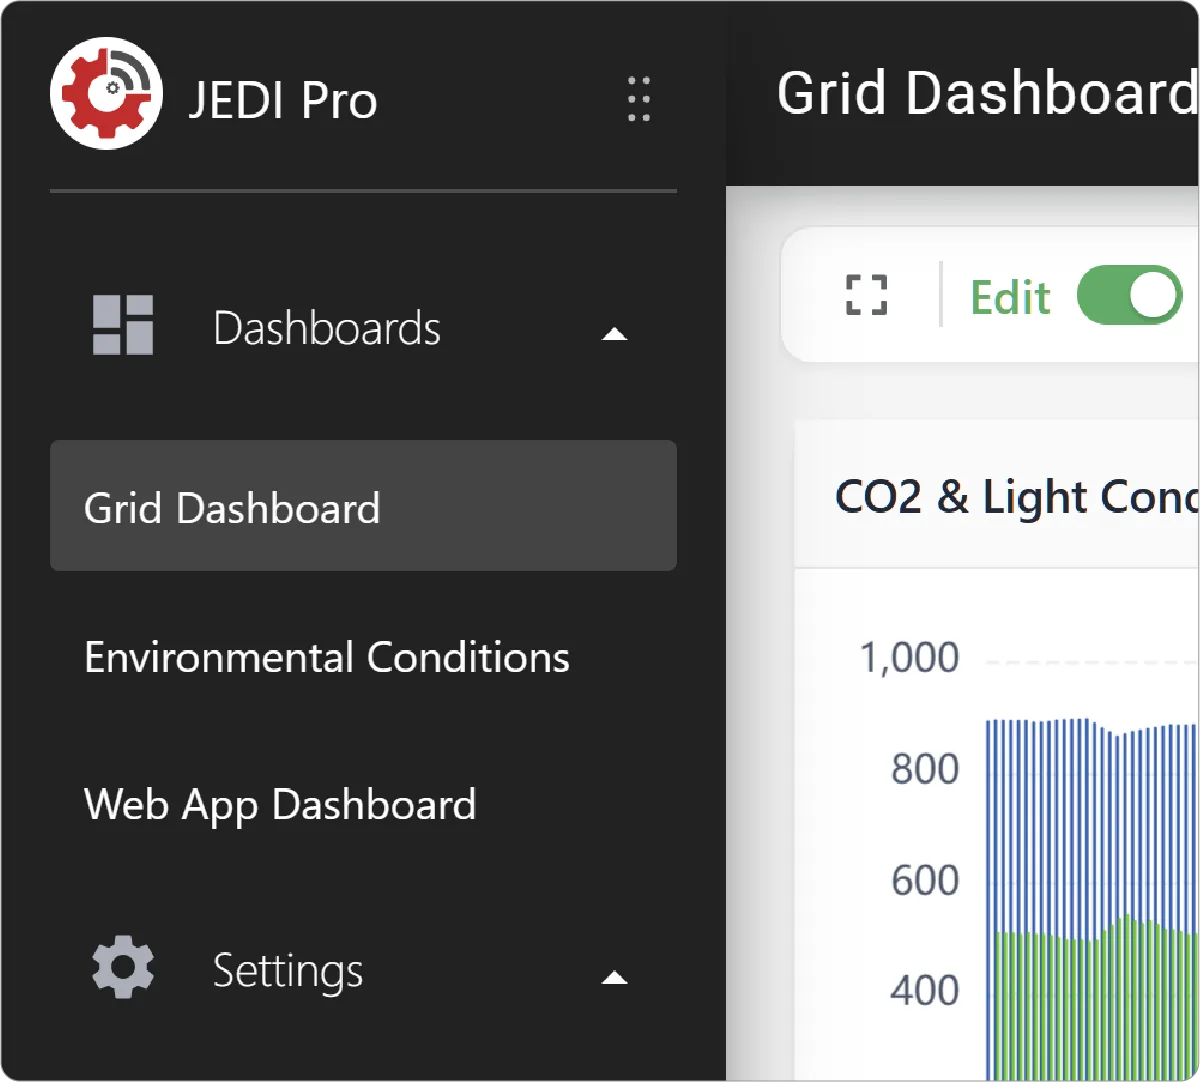
Customize each dashboard for specific context by creating relevant charts with metrics specific to your needs. Move between dashboards seamlessly through the navigation panel to quickly switch contexts and focus on relevant data.
Use Cases
- Operations Monitoring: Track system performance and device health in real time
- Data Analysis: Identify trends and patterns using historical data visualizations
- Testing and Validation: Use dashboards alongside simulated or live data to verify system behavior
- Custom Views: Build tailored dashboards for different groups and users
Best Practices
- Keep dashboards focused and avoid overcrowding with too many widgets
- Use clear labels and titles for better readability
- Choose visualization types that best represent the data
- Regularly review and update dashboards to match evolving needs
Let your data tell its story with Machinechat JEDI's Dashboards!
Need help? Contact our support team: support@machinechat.io