Configuring an HTML Report
HTML Reports allow you to automatically generate professional-looking reports from your device data and email them to one or more users. An HTML report can include formatted text, charts, and tables, making it ideal for daily summaries, status updates, and scheduled monitoring reports.
Requirements
Before configuring an HTML report, make sure the following requirements are met:
- An email notification service (SMTP) has been configured.
- Recipients must be existing JEDI users with valid email addresses.
- Ensure data reception from your devices.
Configure an HTML Report
HTML reports are created as an Action within a Rule and are generated each time the rule is triggered.
Step 1: Create a Rule
- Go to Settings Rules and click on Add Rule.
- Configure the Rule Trigger Settings: Schedule, Condition, or Schedule with Condition.
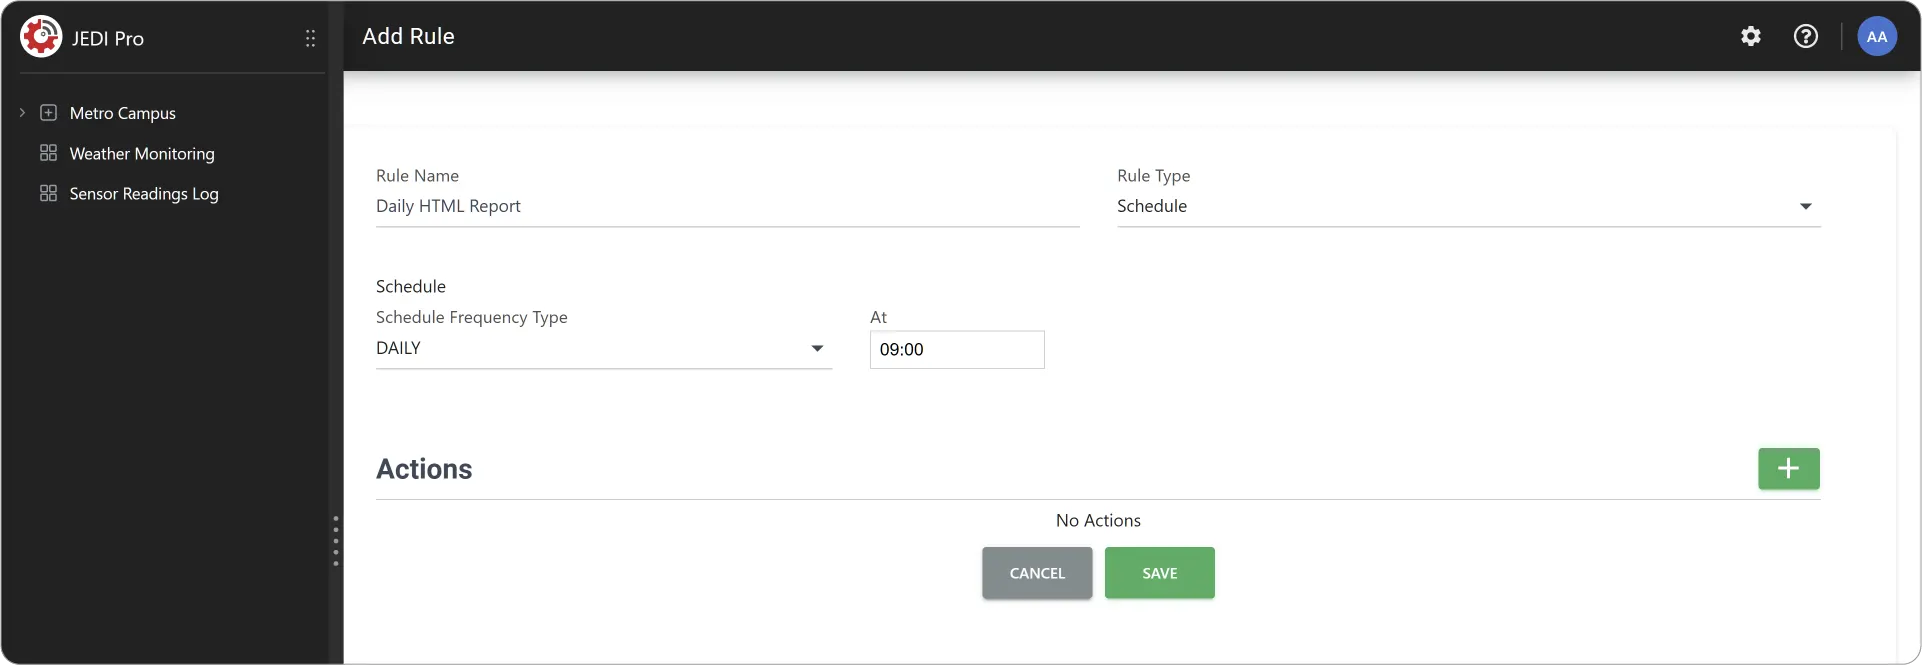
Step 2: Add HTML Report Action
- Under Actions, click Add Action (+).
- Enter an Action Name.
- Set Action Type to HTML Report.
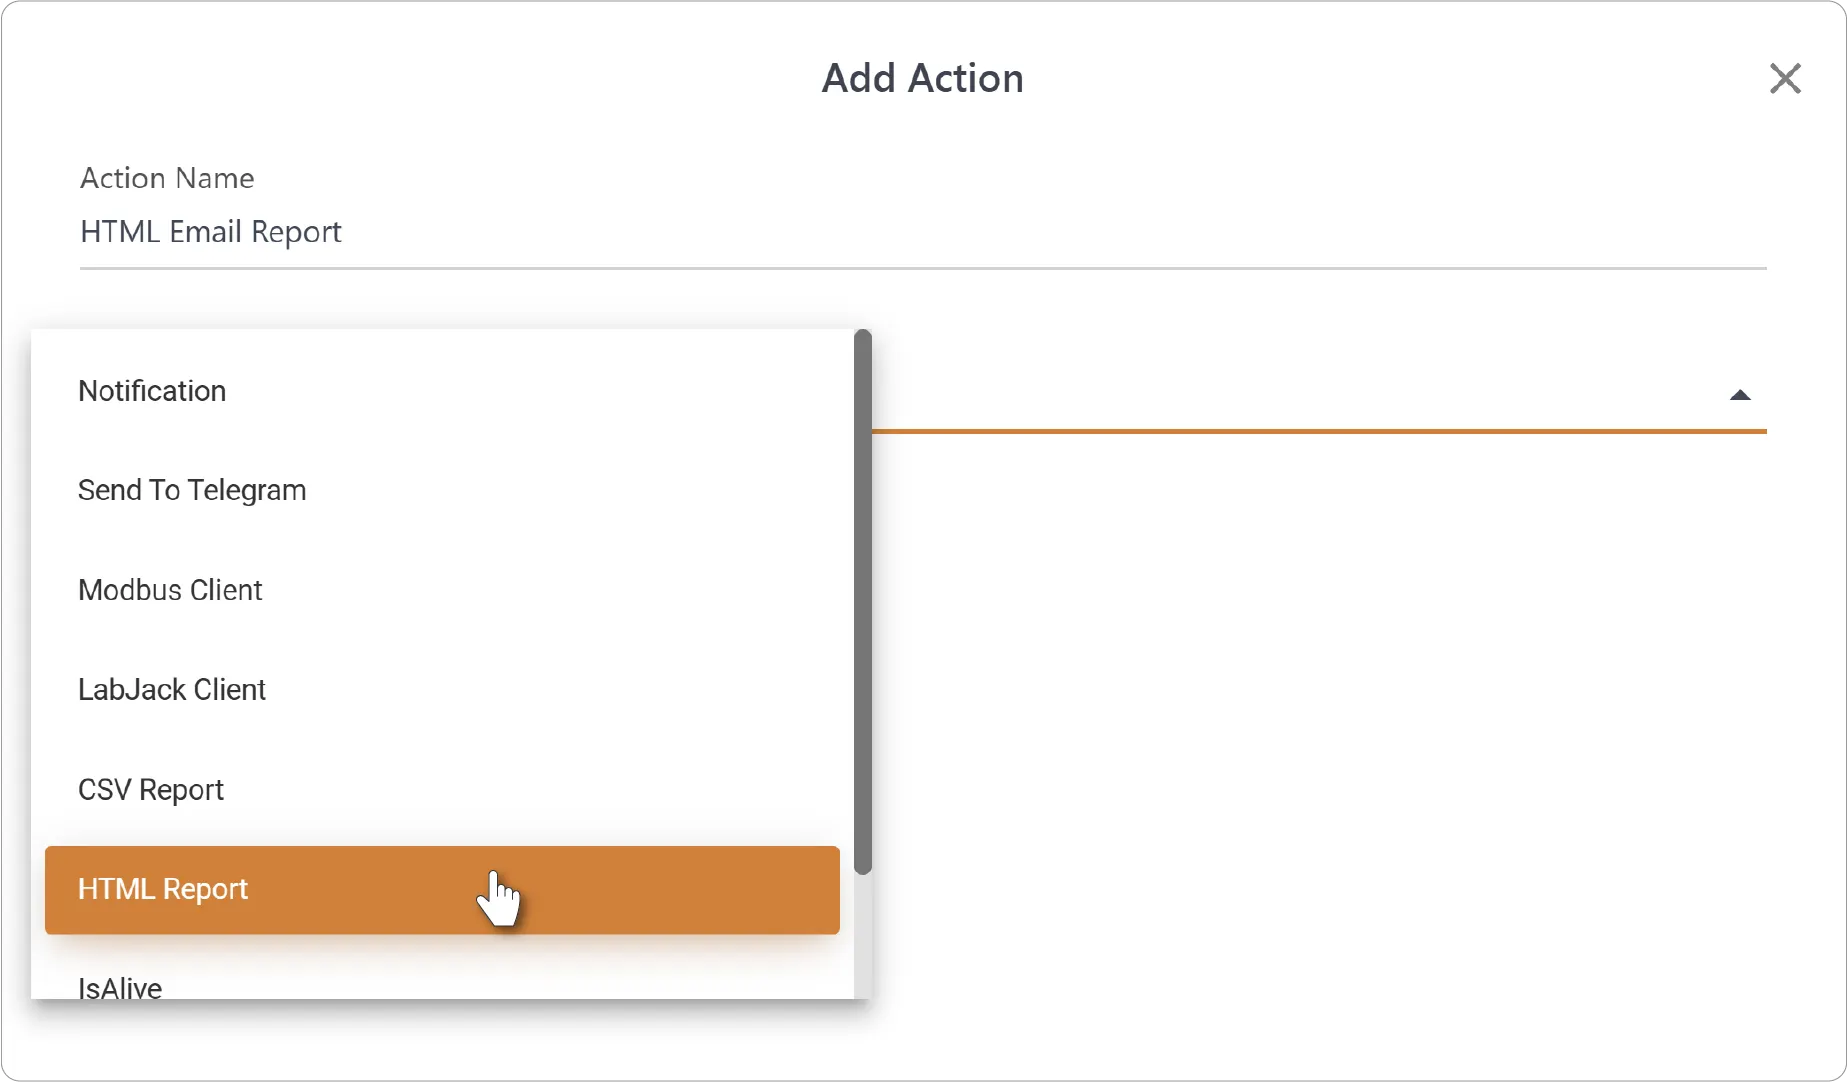
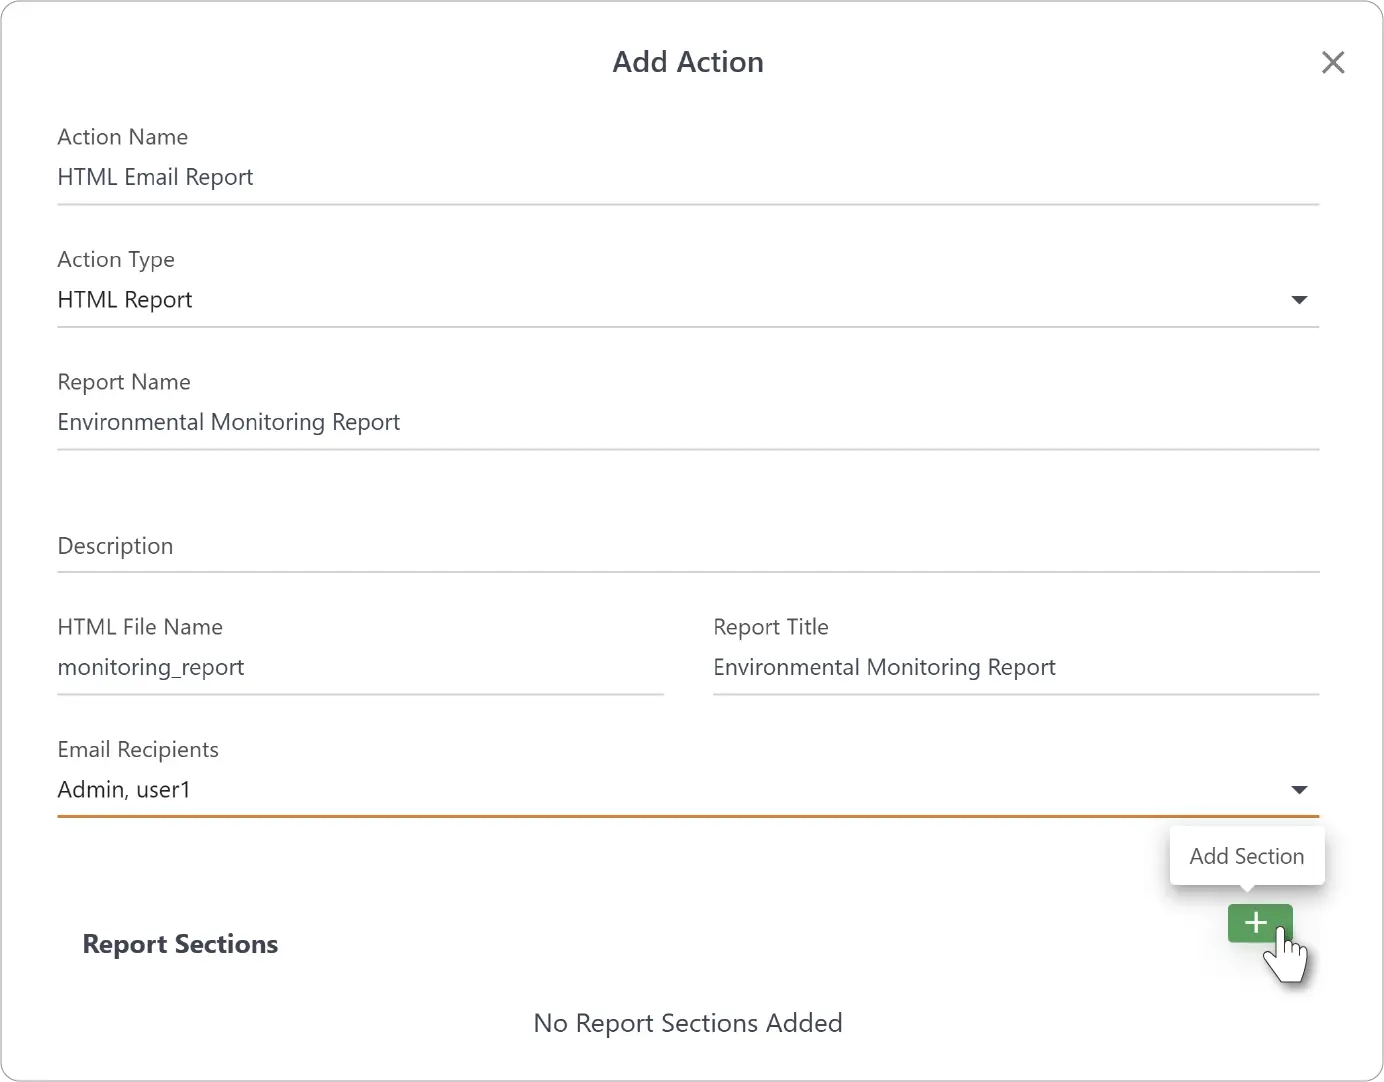
Step 3: Build Your HTML Report
- Enter Report Name, Description (optional), HTML File Name, Report Title, and the Email Recipients.
- Click on Add Section (+) to add Text, Chart, or Table sections to your report.
Text Section
You can use Text Sections for report introductions, maintenance notes, operator comments, and instructions for recipients.
- In Section Configuration, select Section Type as Text.
- Enter Section Title and Content.
- Optionally, adjust Margins.
- Click Add Section.
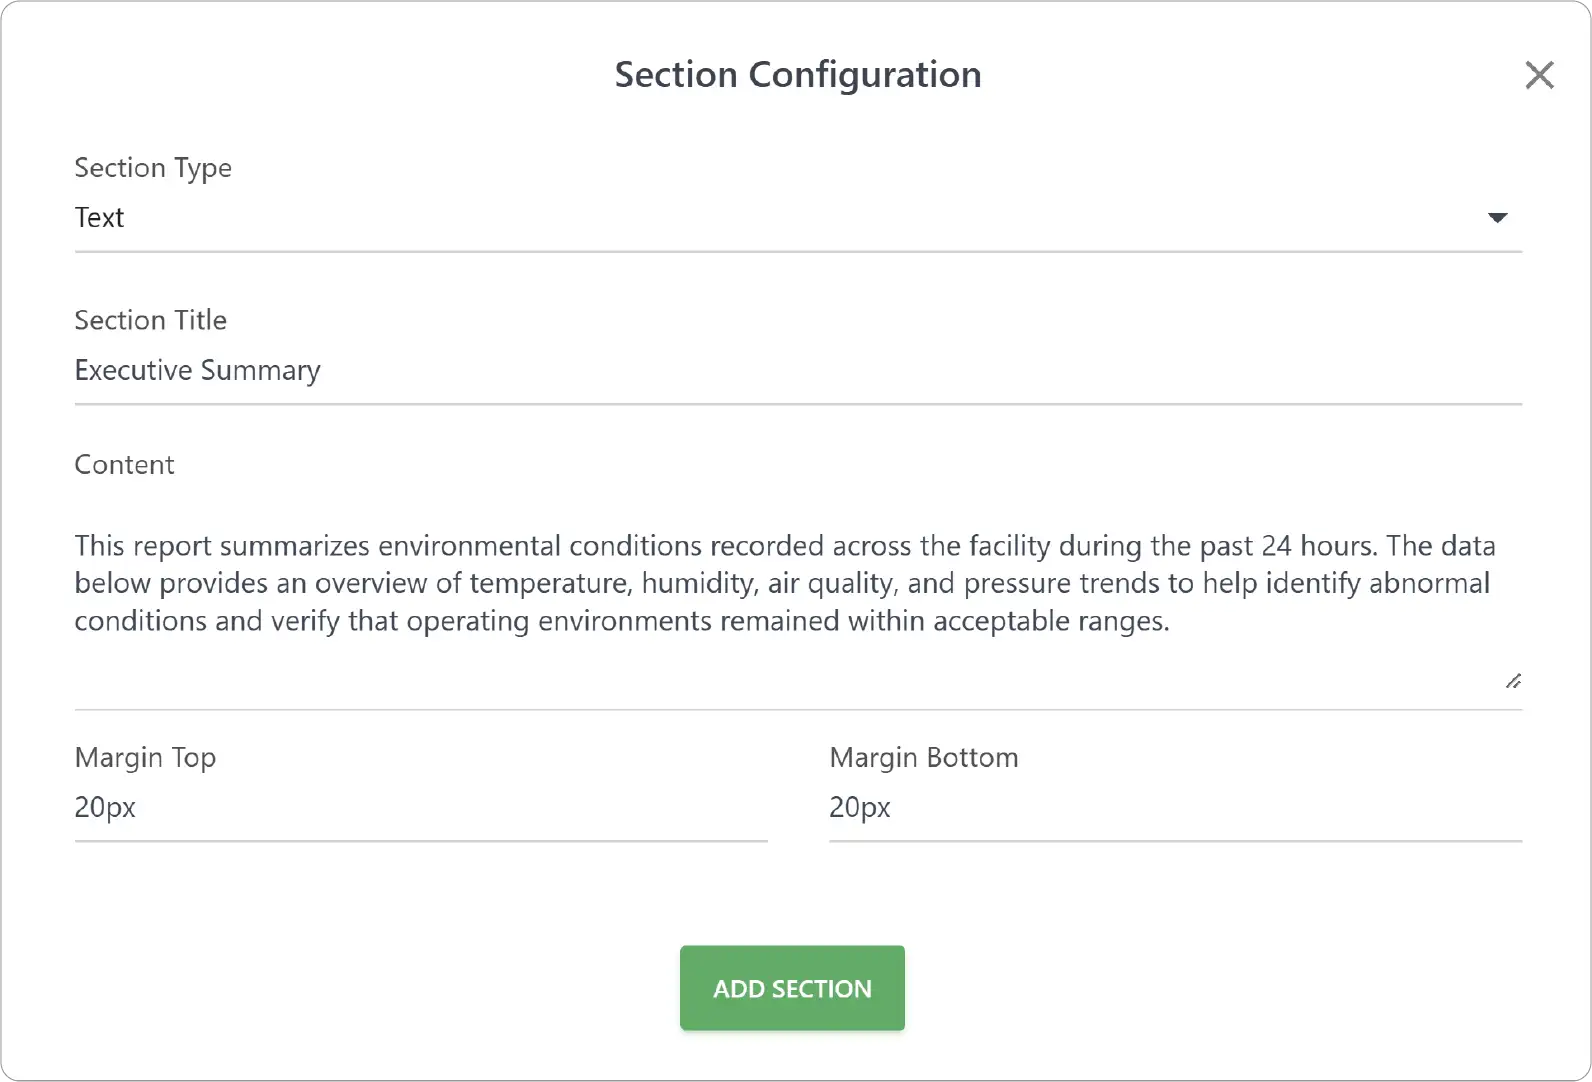
Chart Section
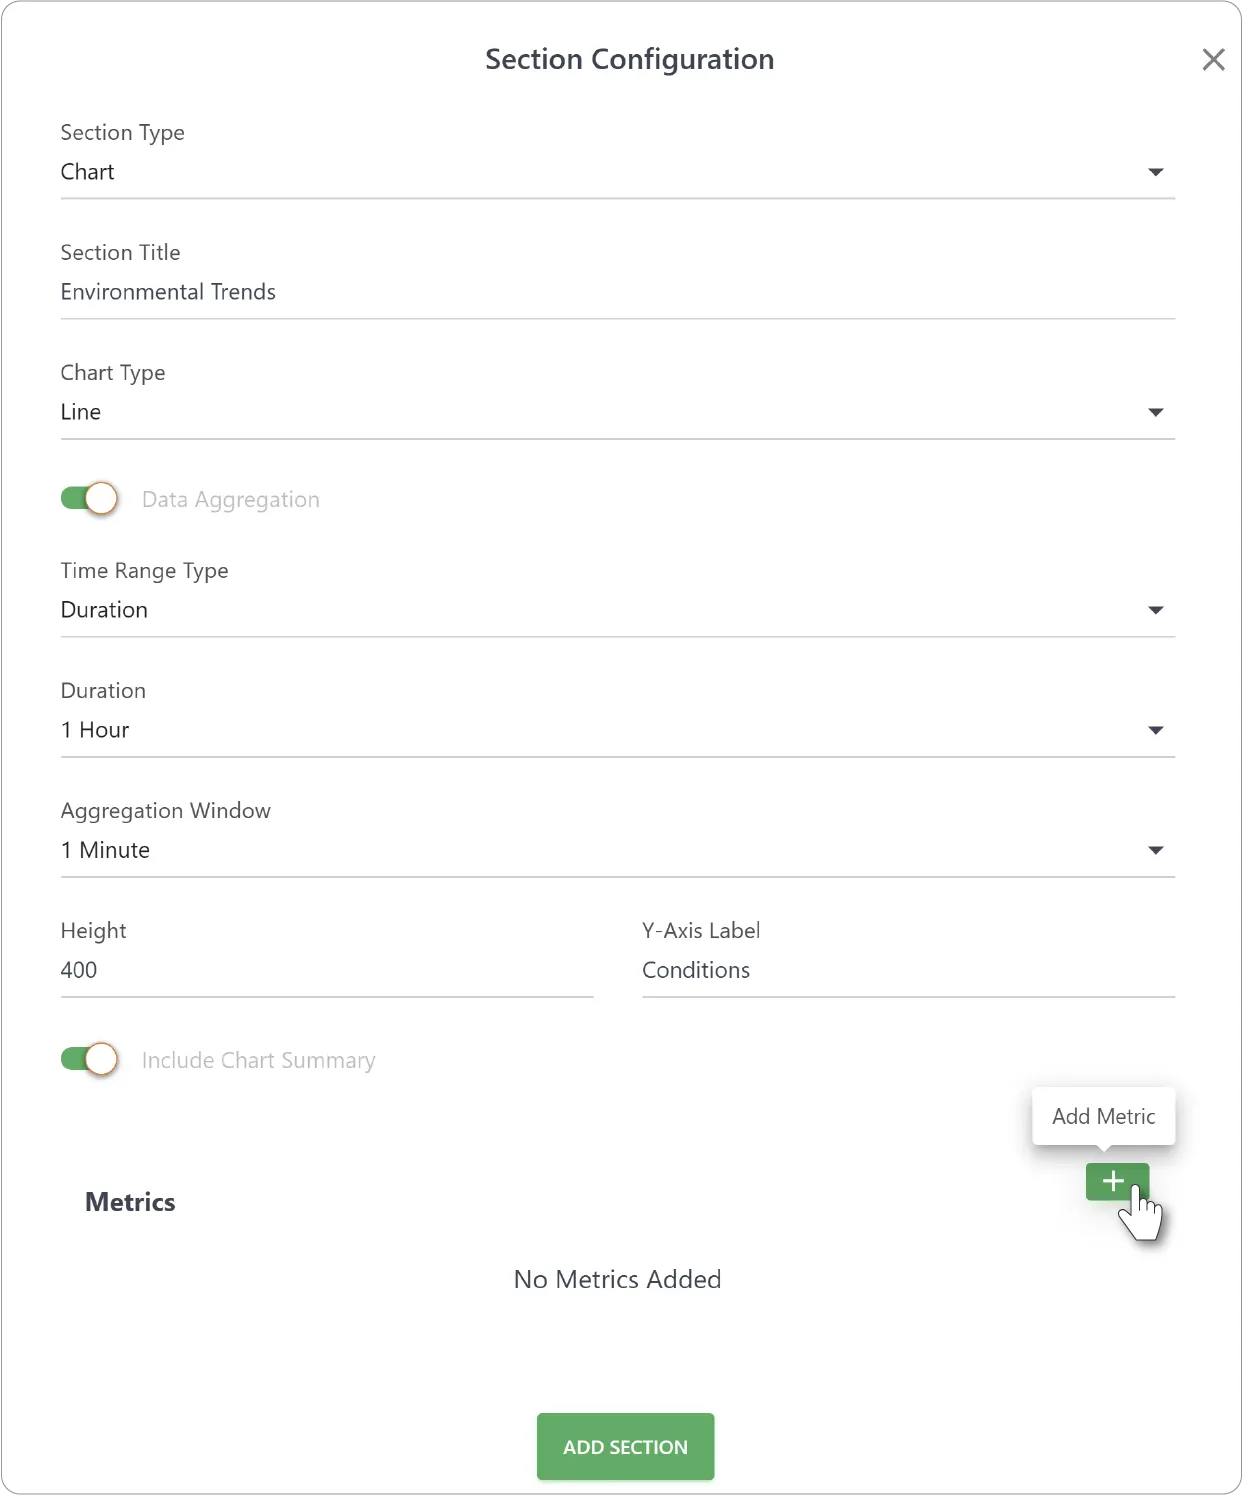
Chart Section displays one or more metrics as a line chart over a selected time period.
- Click on Add Section (+) again and select Section Type as Chart in Section Configuration.
- Enter the following details:
- Section Title
- Chart Type: Currently supports Line charts.
- Data Aggregation: Enable to select an Aggregation Window.
- Time Range Type: Duration or Fixed Range to select a Date Range.
- Aggregation Window: Data aggregation time
- Height:
- Y-Axis Label
- Include Chart Summary
Add Metrics
- Under Metrics, click Add Metric (+).
- Select Device ID, Metric Name, and Aggregation Type (Average, Minimum, Maximum, Count)
- Click Add Metric and add any other relevant metrics.
- Click Add Section to add the Chart Section.
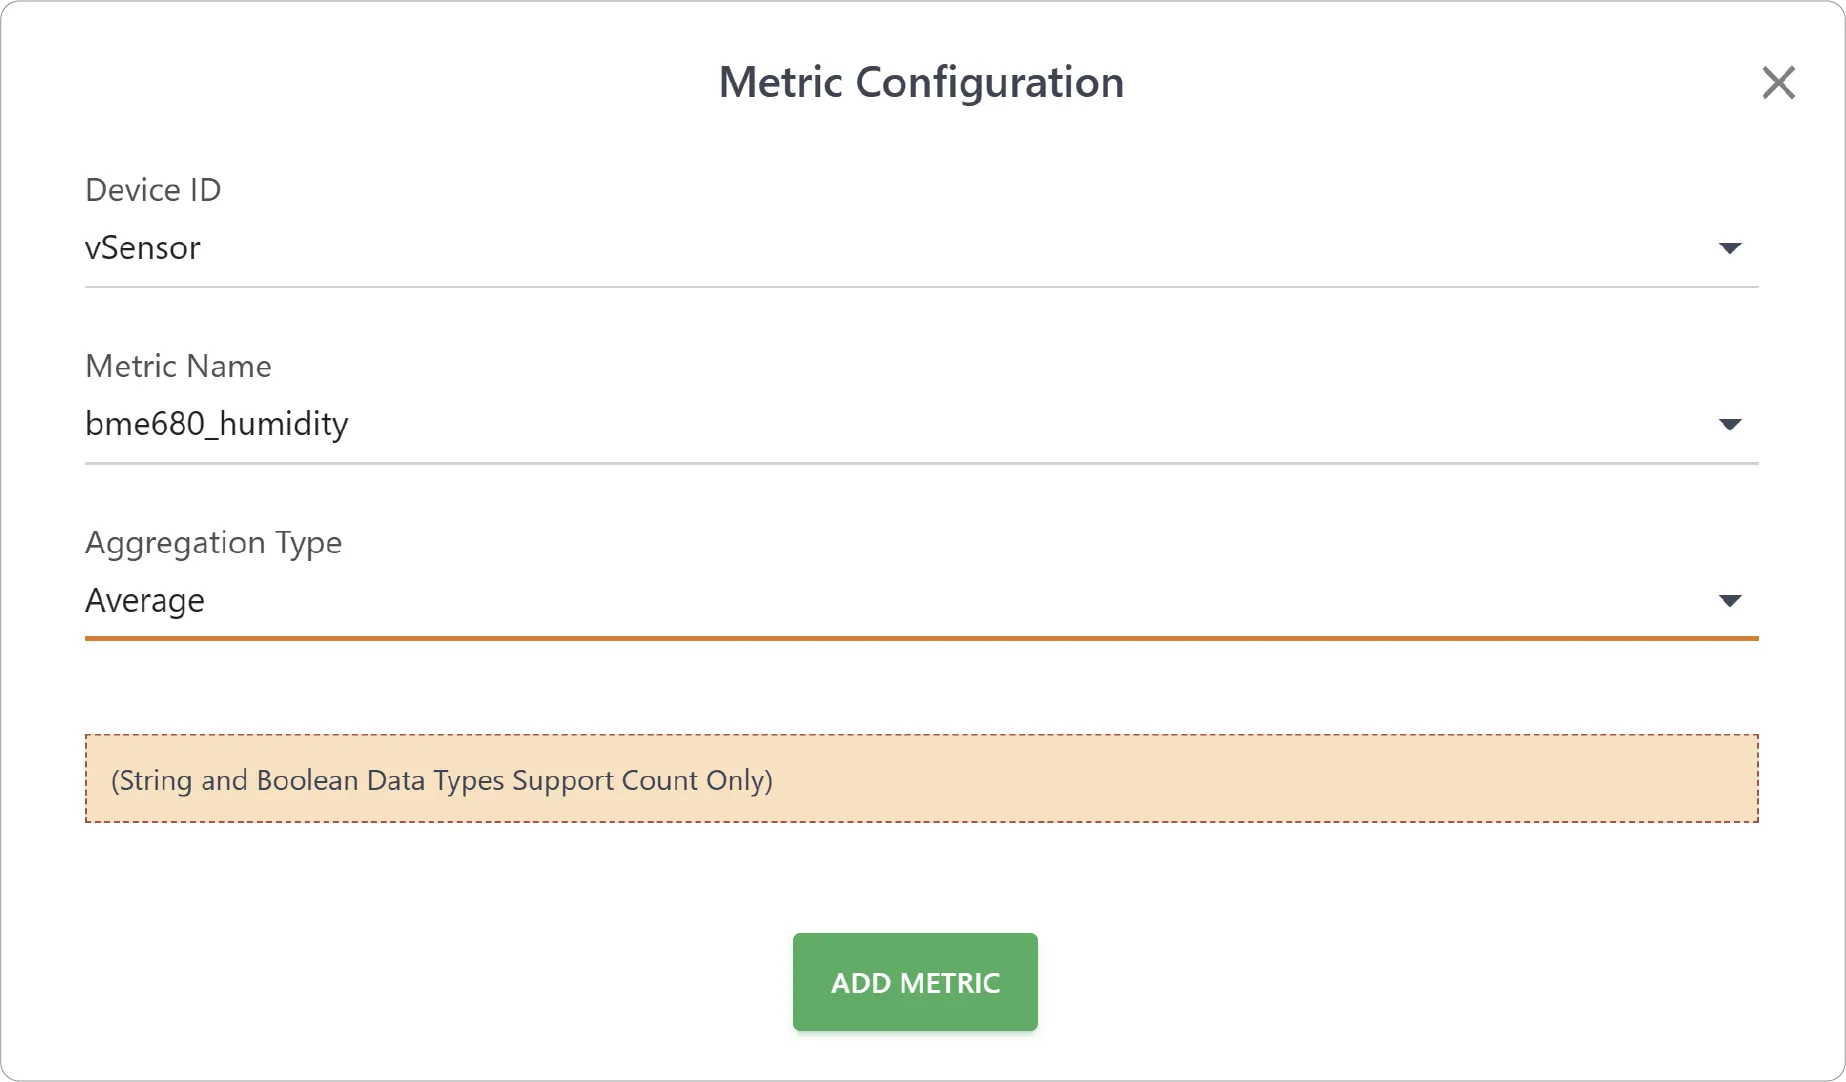
Table Section
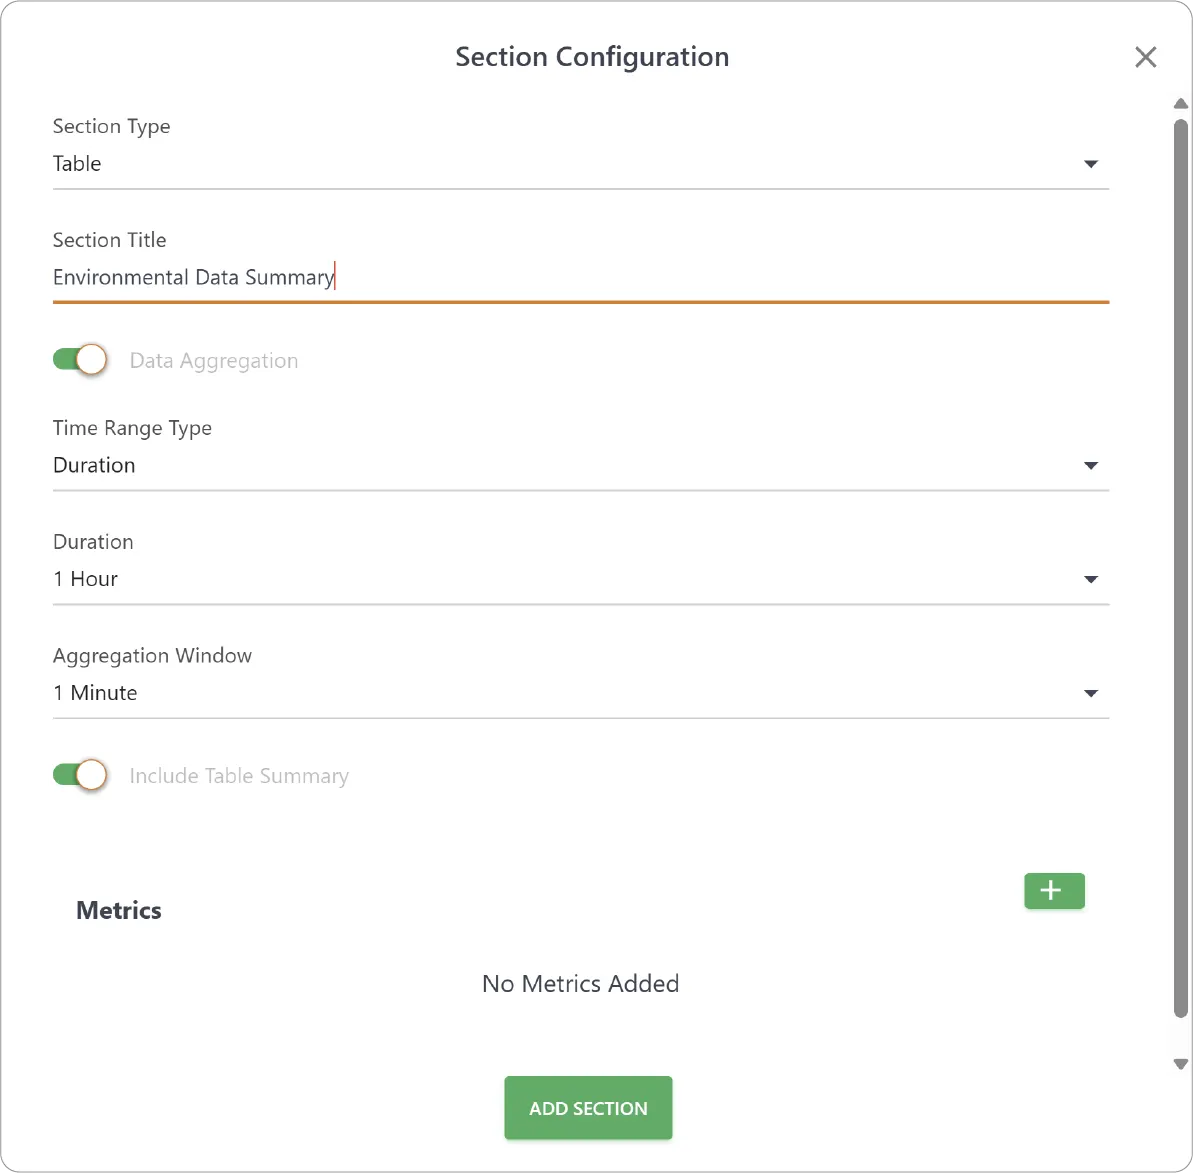
Table Section displays metric values in tabular format over the selected time period.
- Click Add Section (+) and select Section Type as Table in Section Configuration.
- Configure the relevant details just like Chart Section.
- Click Add Metric to add relevant metrics.
- Click Add Section to add the Table Section.
Add the Action and Save the Rule
- Click Add to add the configured Action when you are done building relevant sections.
- Click Save to save your Rule.
- You can Edit both your Rules and Actions if necessary.
- When the Rule is triggered, you will receive an email with the HTML Report as attachment.
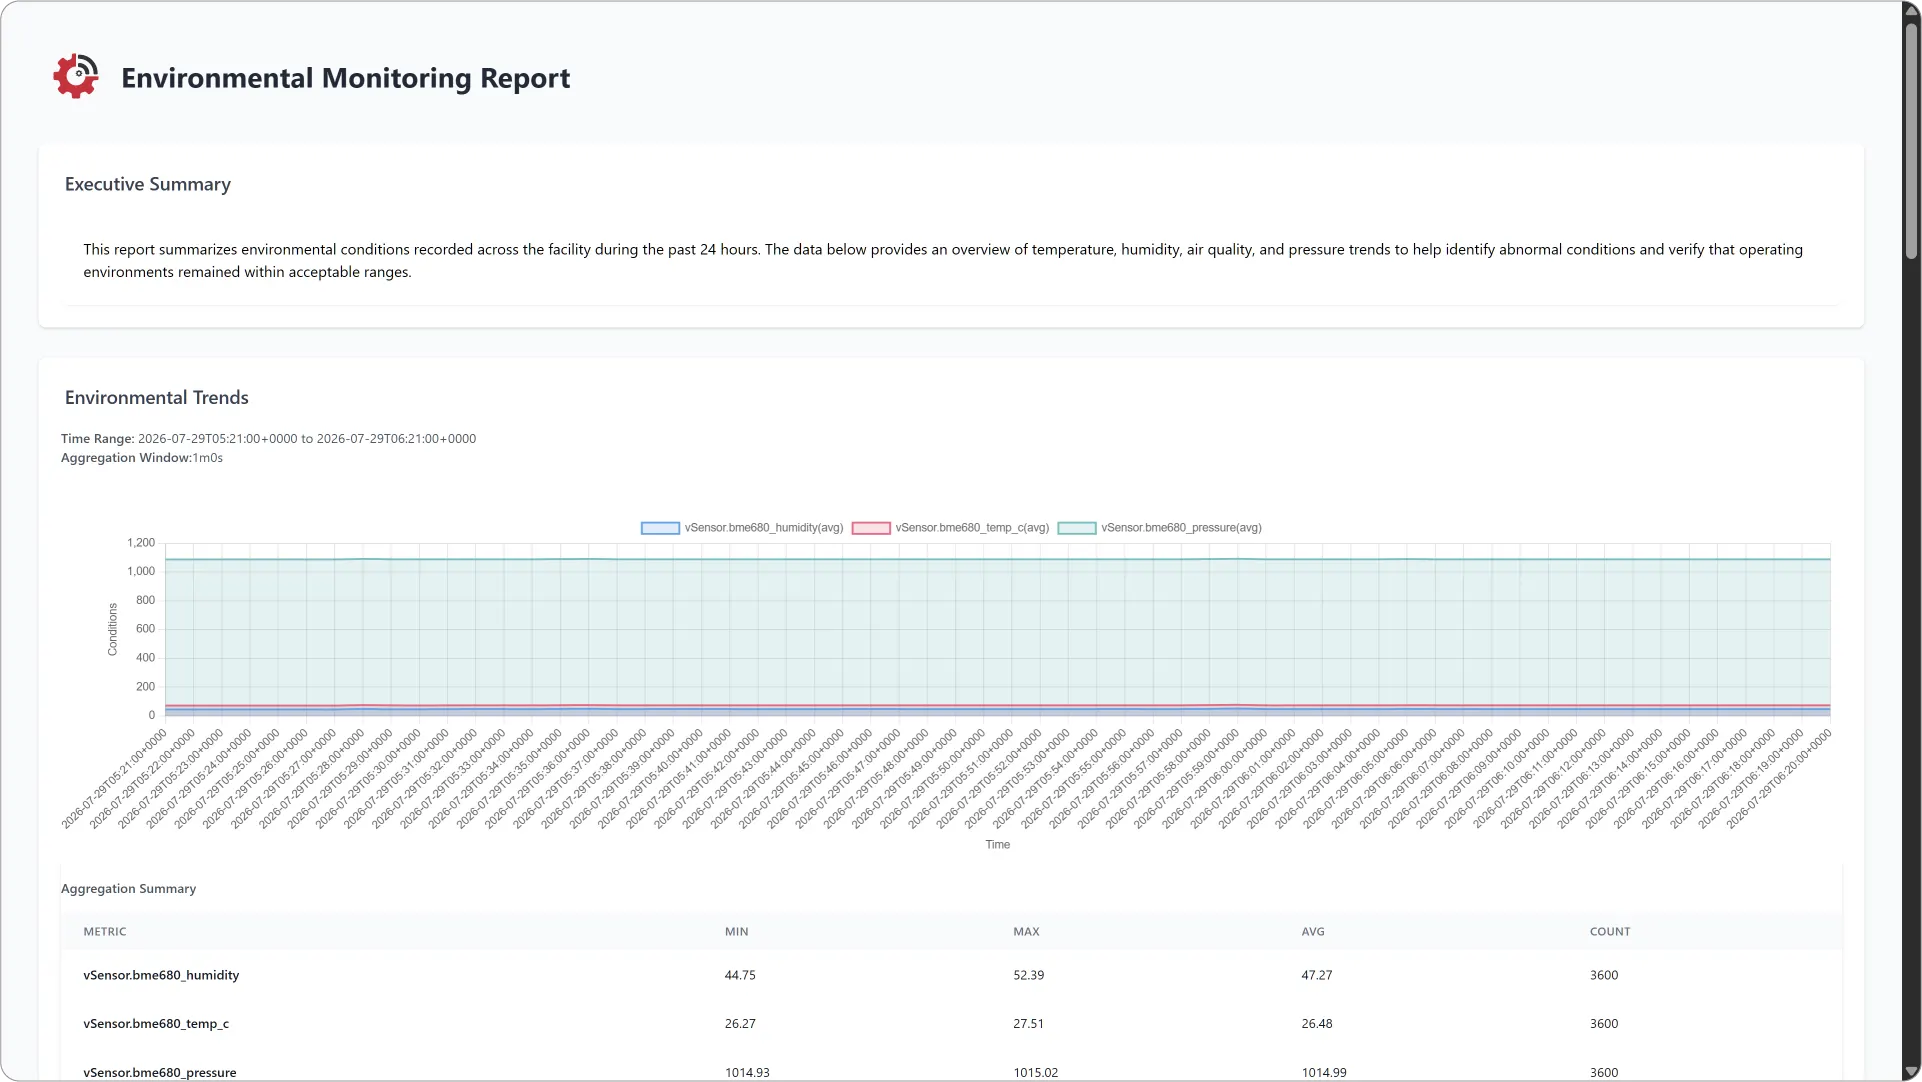
HTML reports provide an easy way to deliver clear, visual summaries of your monitored data directly to your team. If you want a format suitable for Excel, Google Sheets, and other analytics applications, check out CSV Reports.
Need help?
Contact our support team: support@machinechat.io