Instantly Visualize Device Status with the LED Chart
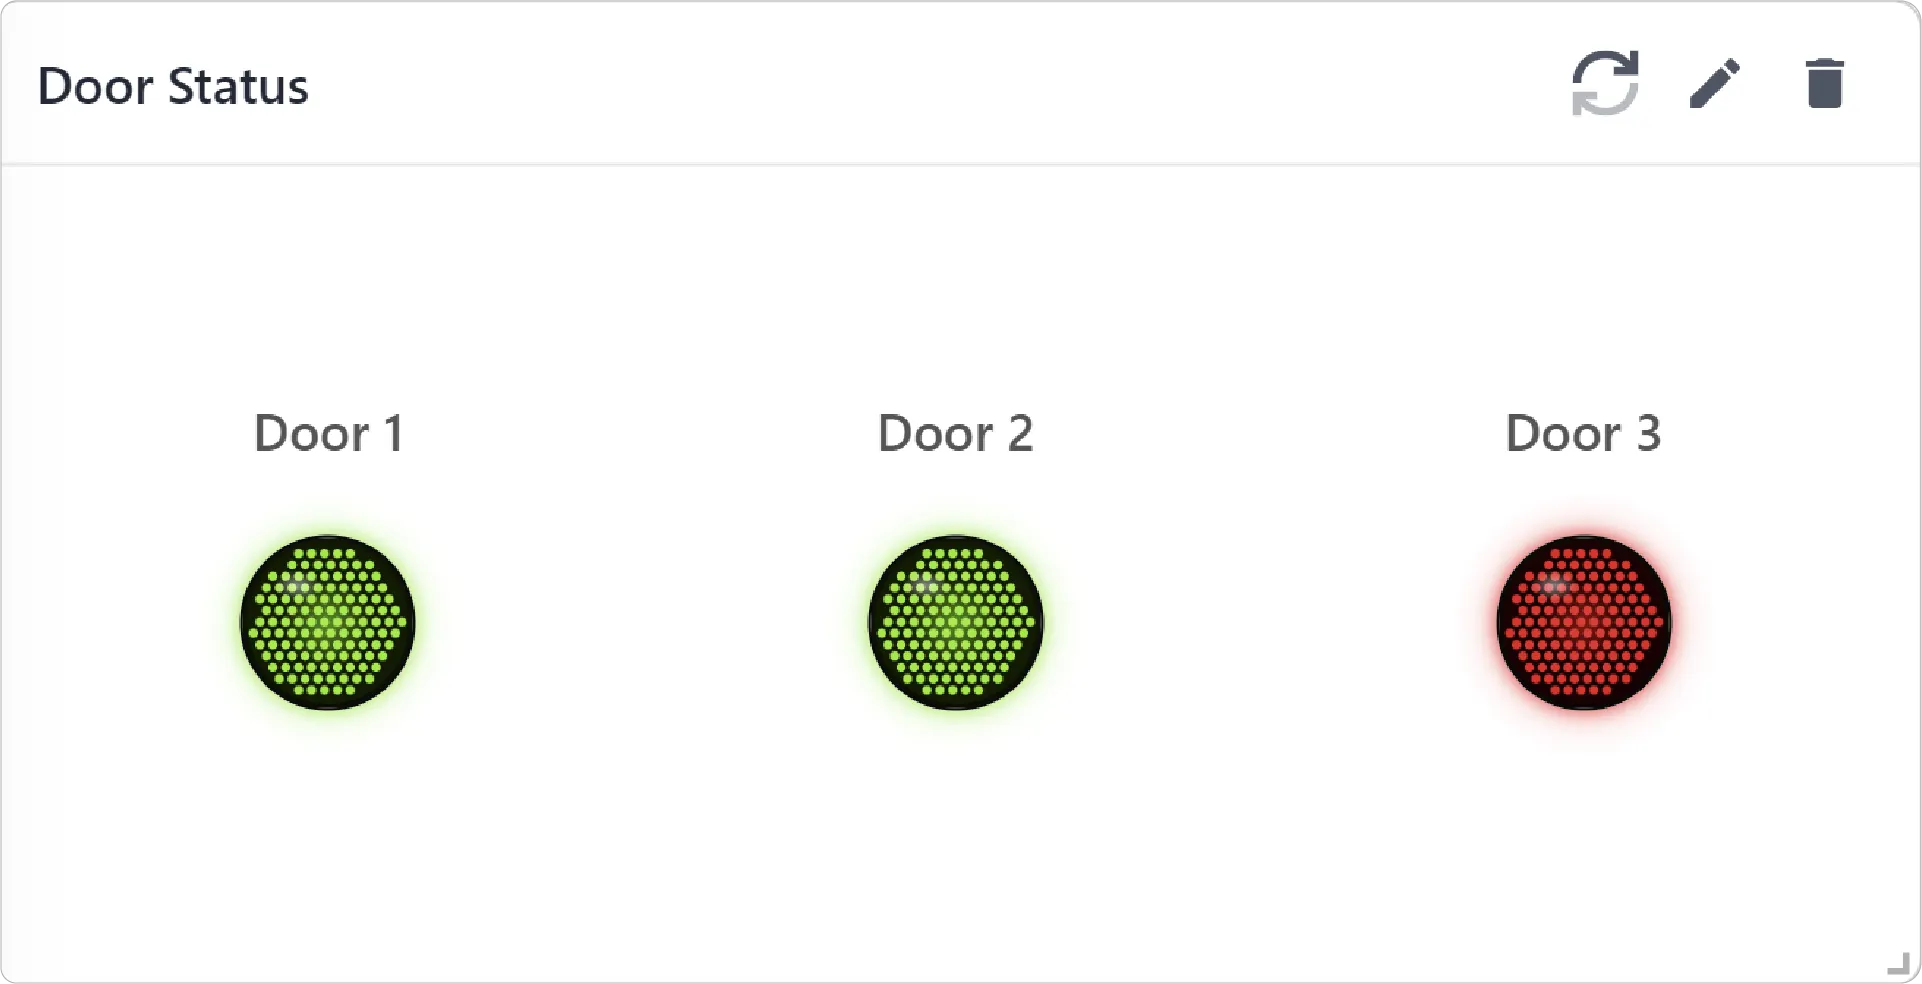
The LED Chart provides a simple yet highly effective way to visualize boolean states across devices and systems. With animated LED indicators, customizable color settings, and grouping support, it enables operators to quickly identify status changes and monitor system health at a glance.
Key Features:
-
Real-Time LED Status Indicators
Visualize live boolean states using animated LED-style indicators that instantly reflect device or metric status changes.
-
Multi-LED Grouping
Group multiple LED indicators together by row or column layout for efficient monitoring across multiple devices or metrics.
-
Adjustable LED Sizing
Customize LED sizes to optimize visibility for different dashboard layouts and display environments.
Configuration
LED Chart for Grid Dashboard
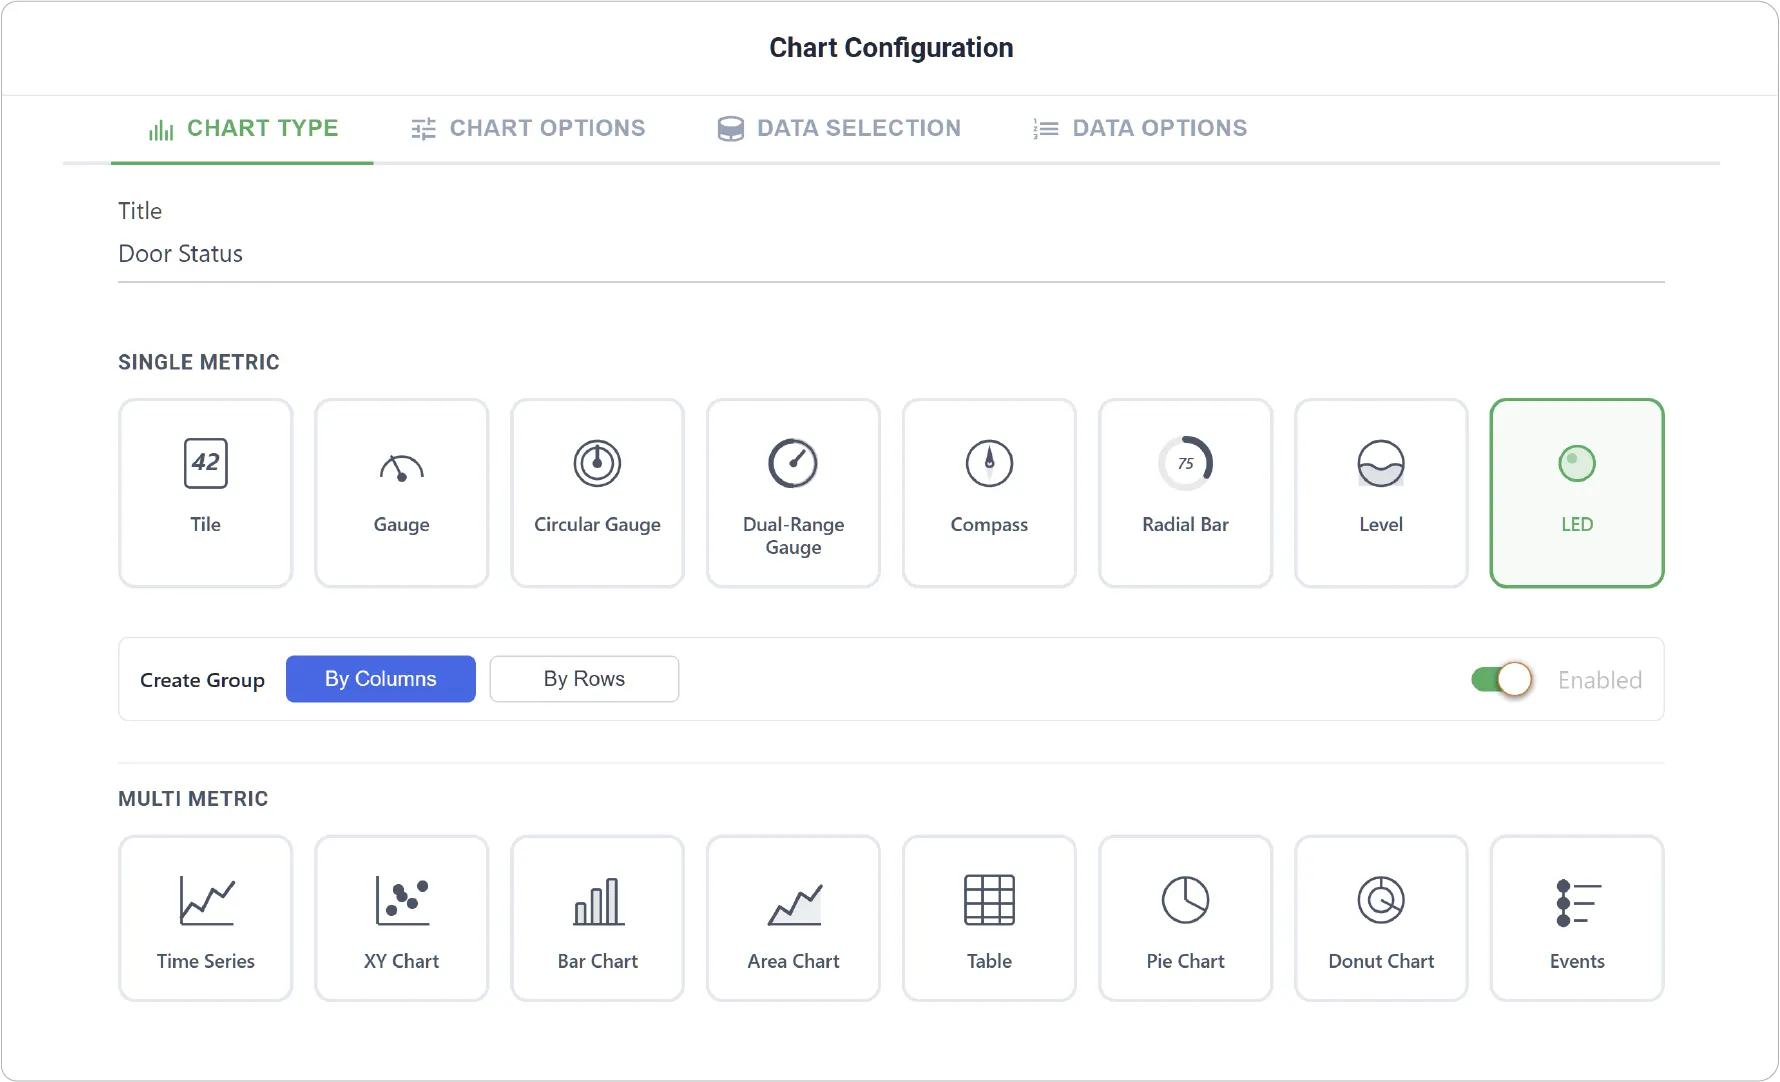
- Chart Type: Set a custom title and select the LED Chart as the visualization type.
- Create Group: Enable grouping to display multiple LED indicators together in either row or column layout.
-
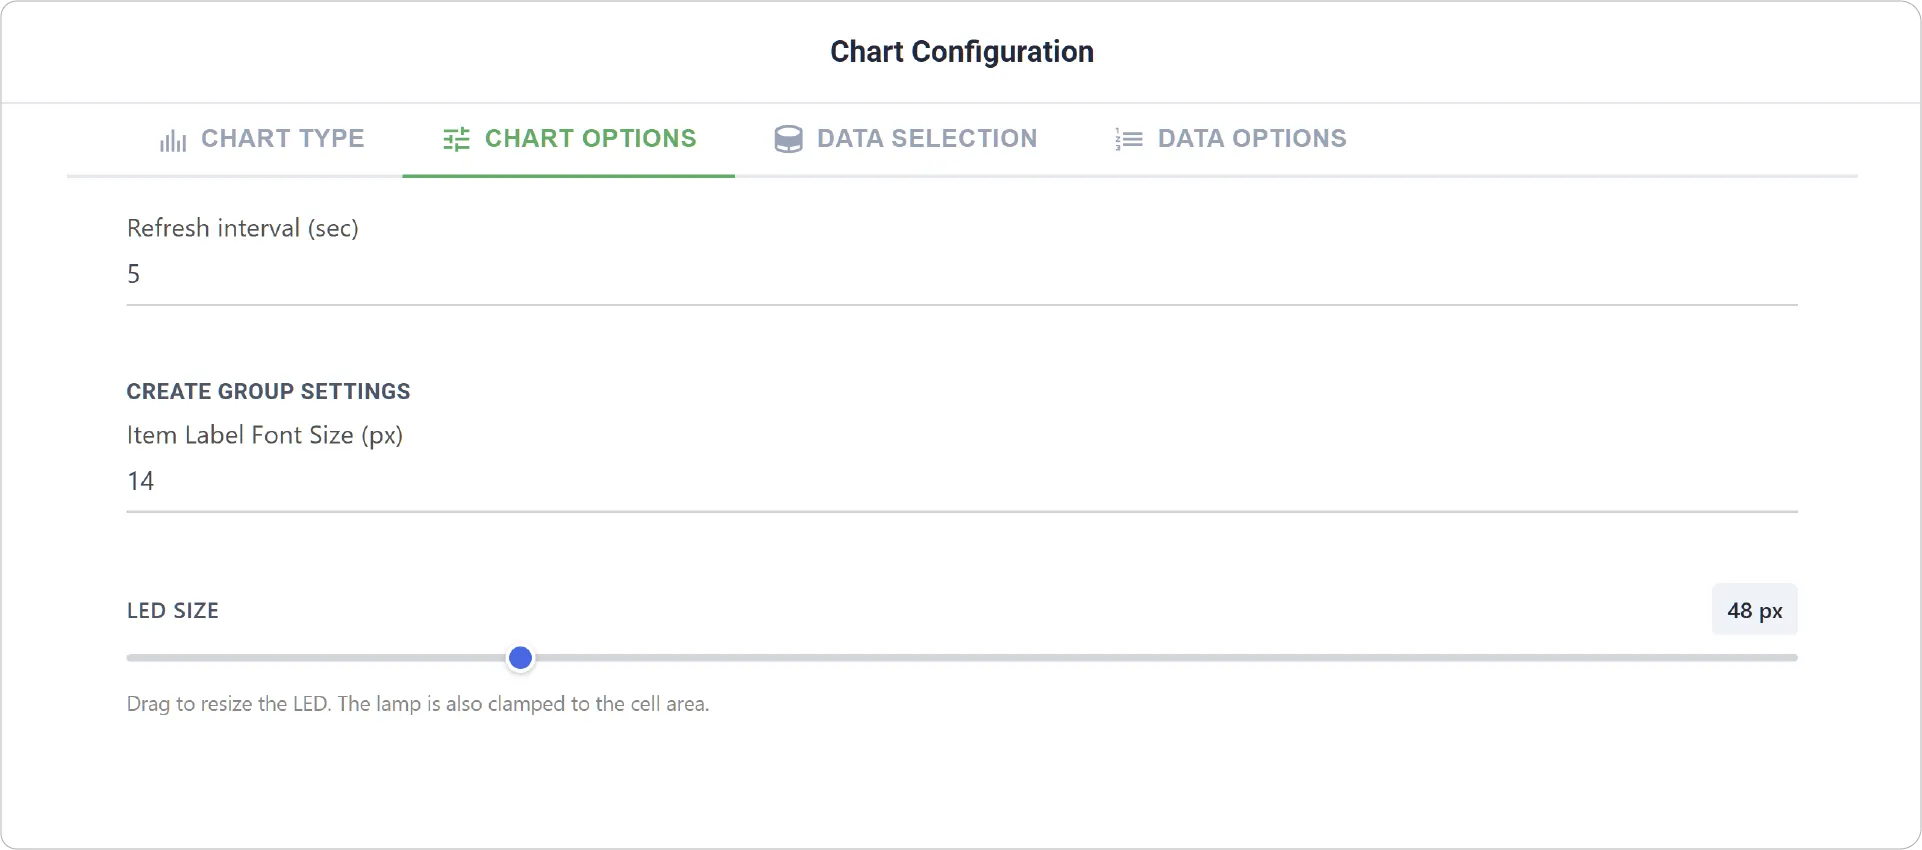
Chart Options: Customize the appearance and behavior of the LED Chart.
- Refresh Interval: Define how often the LED Chart updates with new data.
- LED Size: Adjust the size of the LED indicators.
- True and False Color Selection: Select colors for true and false states. Available in the Data Selection tab when grouping is enabled.
- Create Group Settings: Available when Create Group is enabled. Set Label Font Size for each grouped LED indicator.
- Link Dashboard: Enable to link this chart to another dashboard.
-
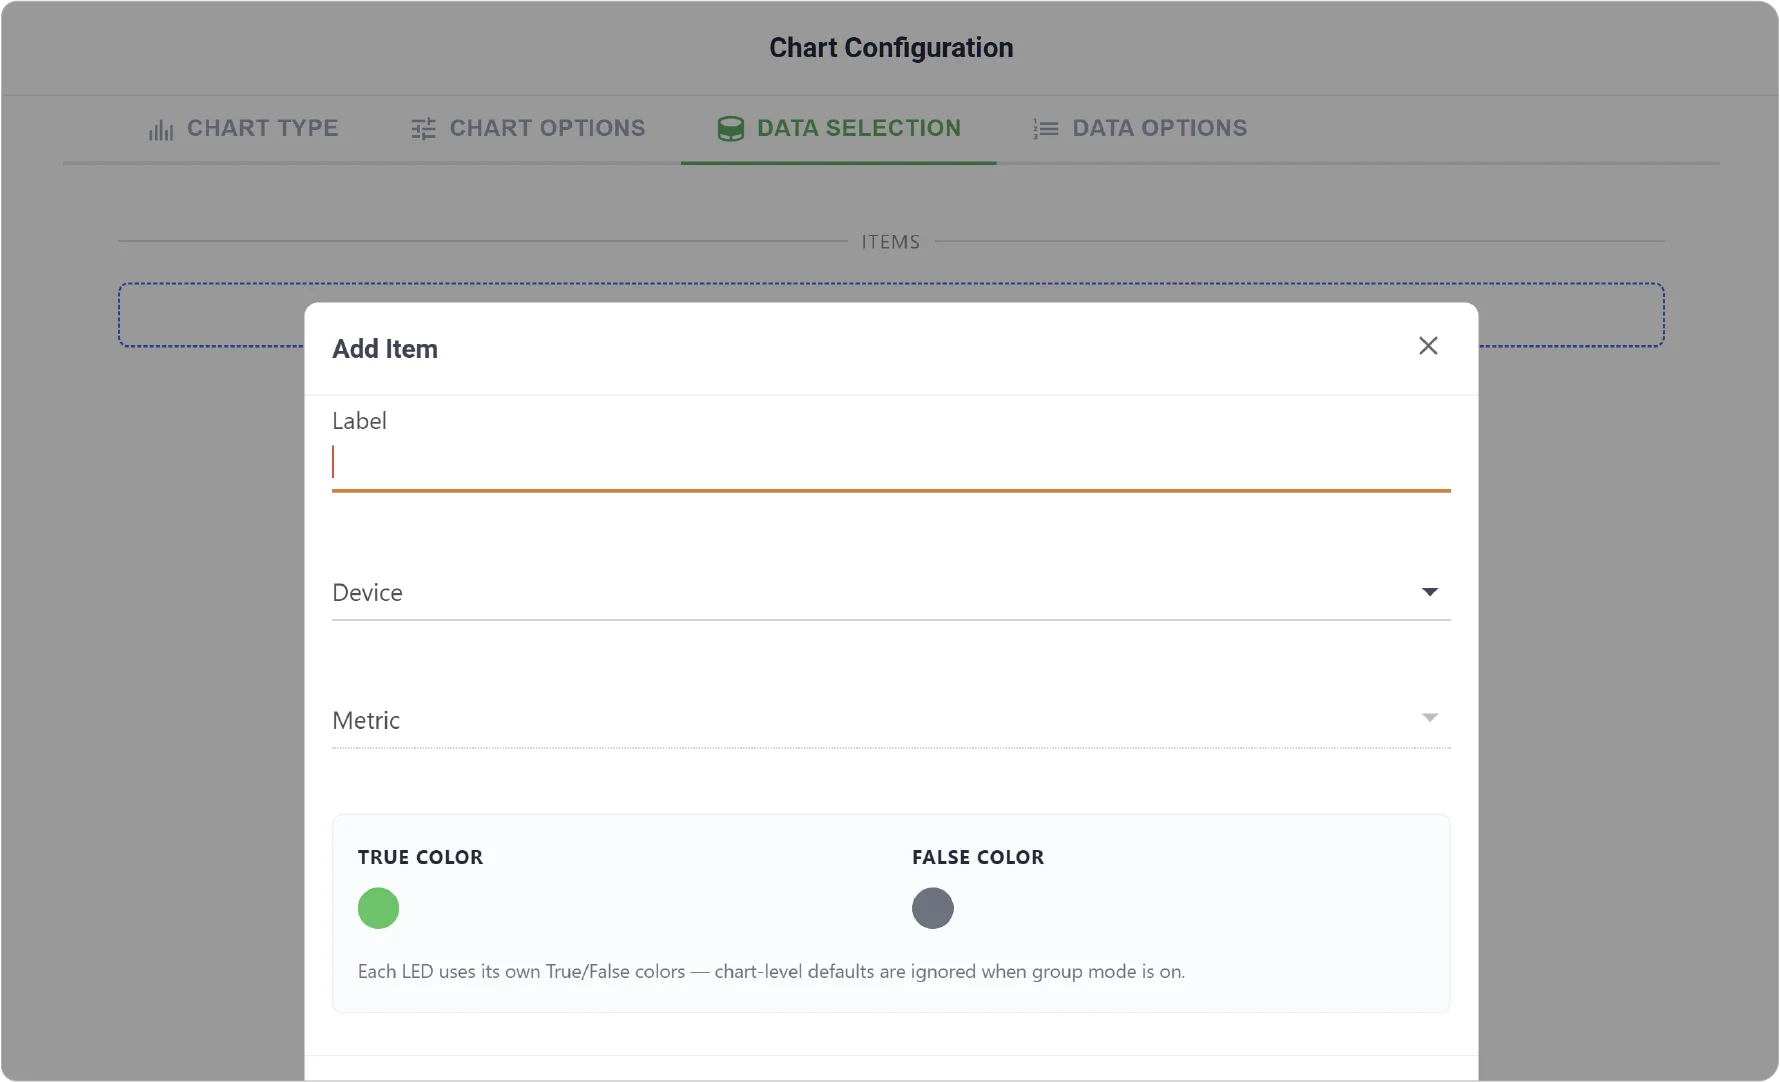
Data Selection: Choose the device and relevant boolean metrics to display.
- Add Item: Available when grouping is enabled, allowing addition of multiple LED indicators.
- Label: Enter labels for grouped LED indicators.
- True/False Color Selection: Assign custom colors for true and false states for respective grouped LED indicator.
- Data Options: Not applicable for the LED Chart.
Real-World Examples:
-
Door And Access Monitoring:
Track door open/closed status across facilities, server rooms, or restricted areas.
-
Smart Building Automation:
Display lighting, HVAC, occupancy, or system states in real time.
-
Network And Connectivity Monitoring:
Monitor device online/offline states and communication health across IoT deployments.
Ready to build powerful dashboards? Explore additional visualizations to create complete real-time monitoring experiences!
Need help? Contact our support team: support@machinechat.io