Track Direction with JEDI's Compass Chart
Compass Chart is a single-metric visualization designed to display directional data. It represents values as an angle or heading on a compass dial, making it ideal for metrics related to orientation, direction, or rotation.
Key Features
-
Directional Visualization
Displays data as a heading on a compass dial
-
Intuitive Orientation Display
Easily interpret angles such as North, South, East, and West
-
Real-Time Updates
Reflects live changes in directional data
-
Clear Visual Feedback
Quickly identify shifts in direction or movement
Configuration
Compass Chart for Grid Dashboard
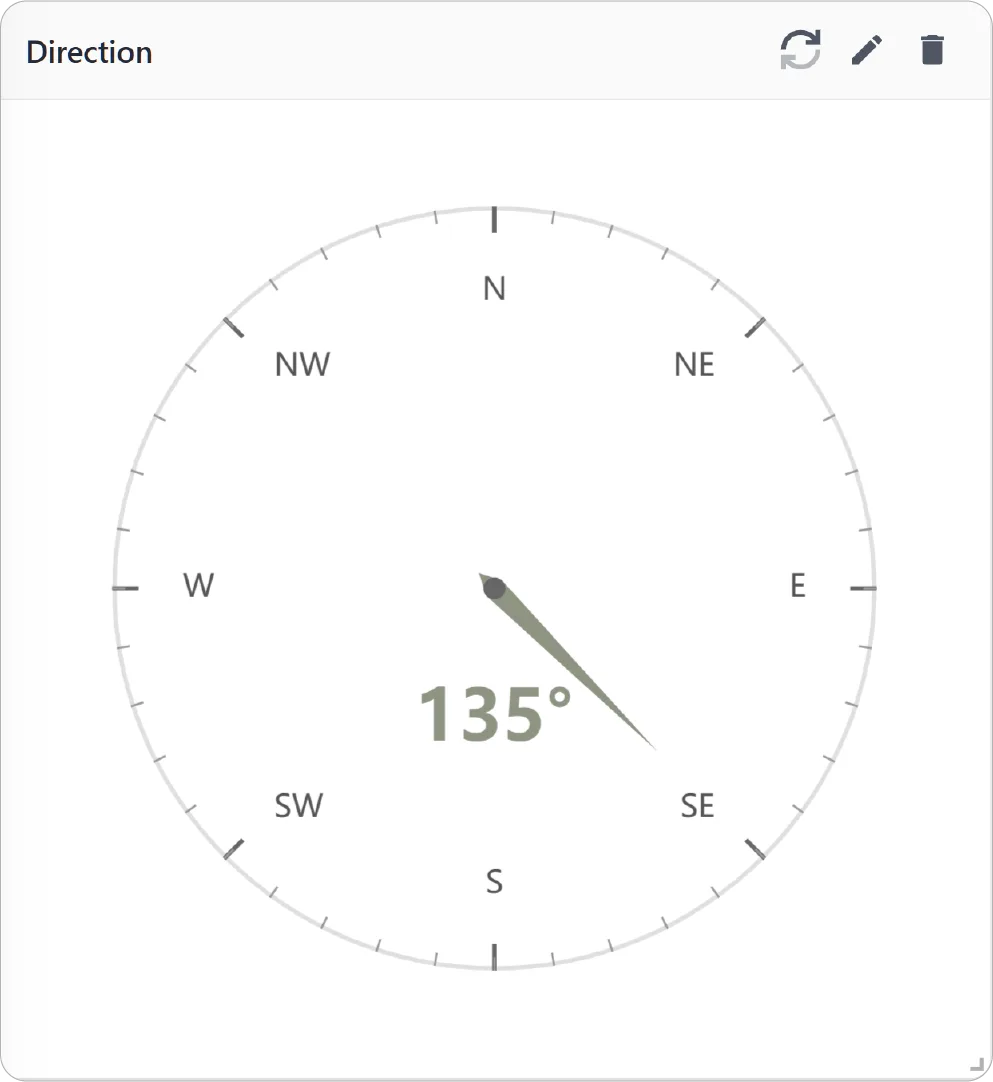
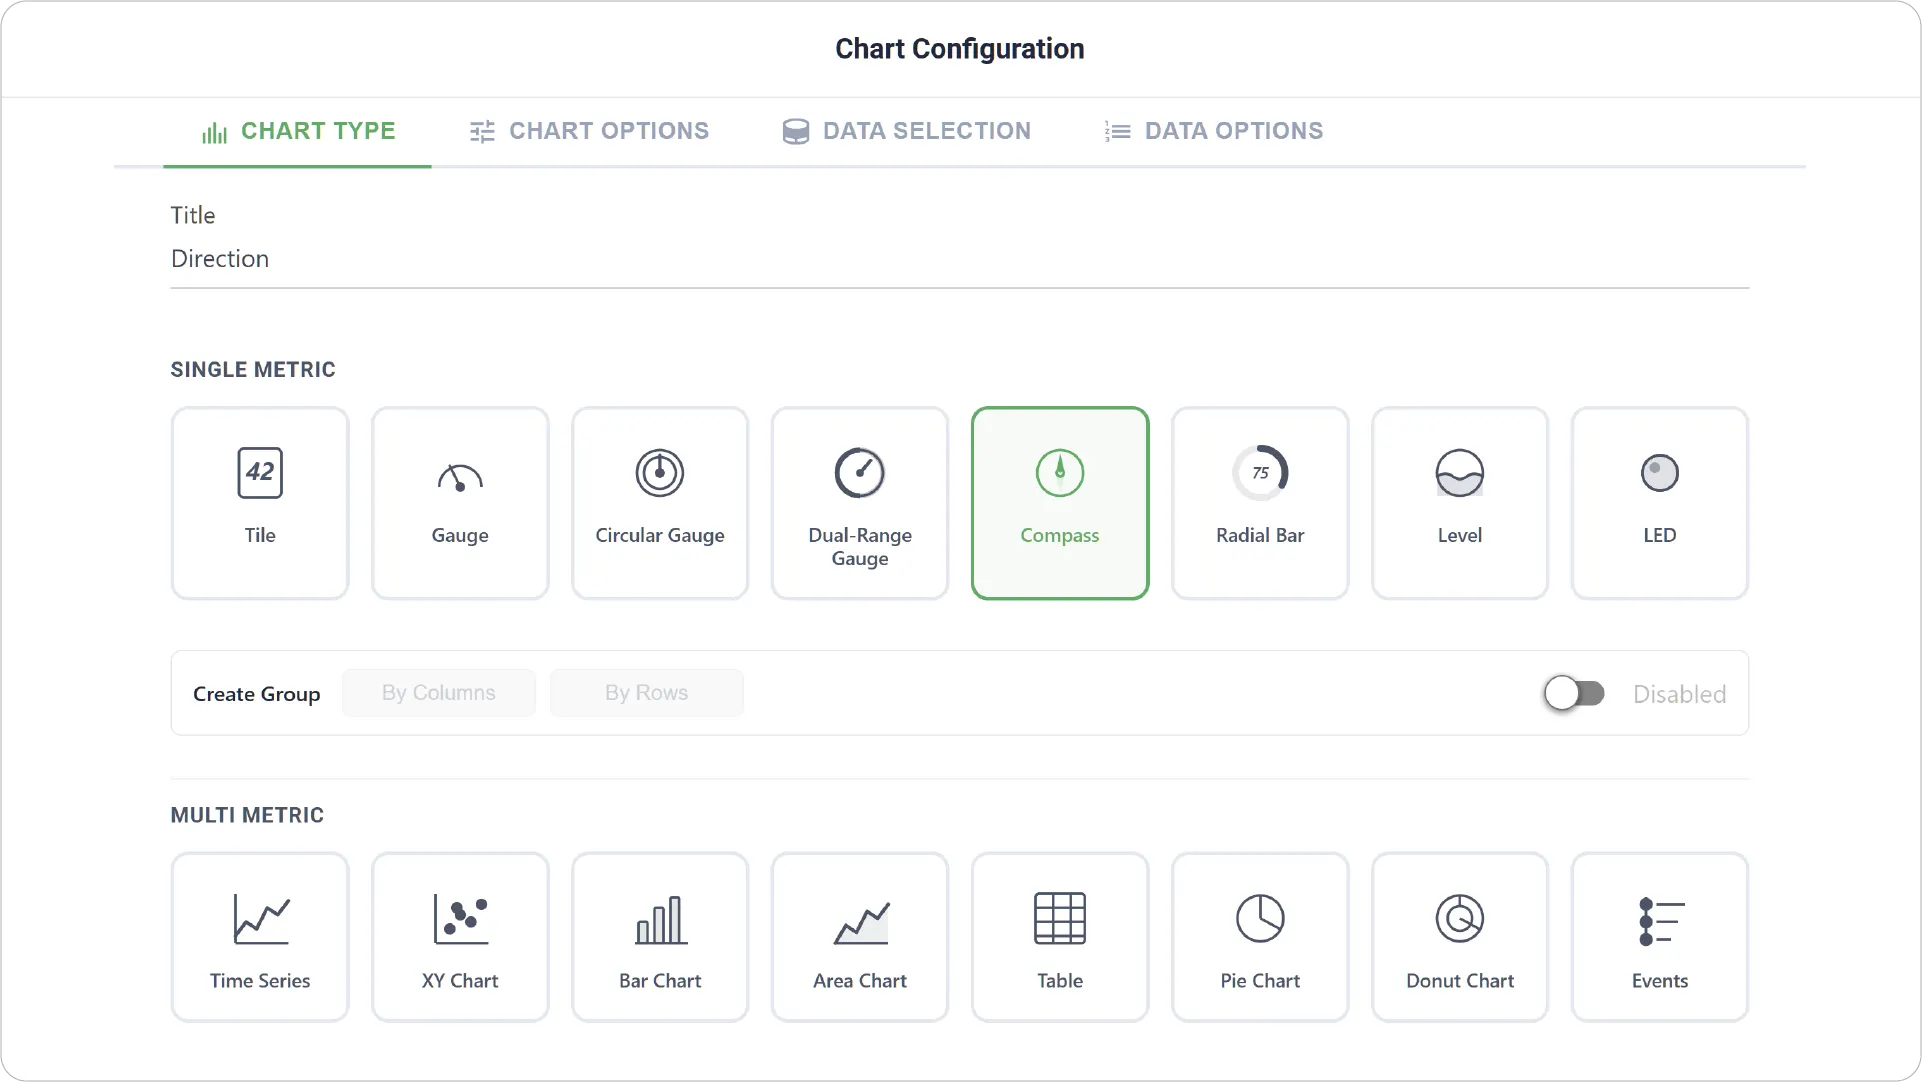
- Chart Type: Select the Compass Chart type and provide a title for your chart.
- Enabling Create Group allows you to add more than one Compass.
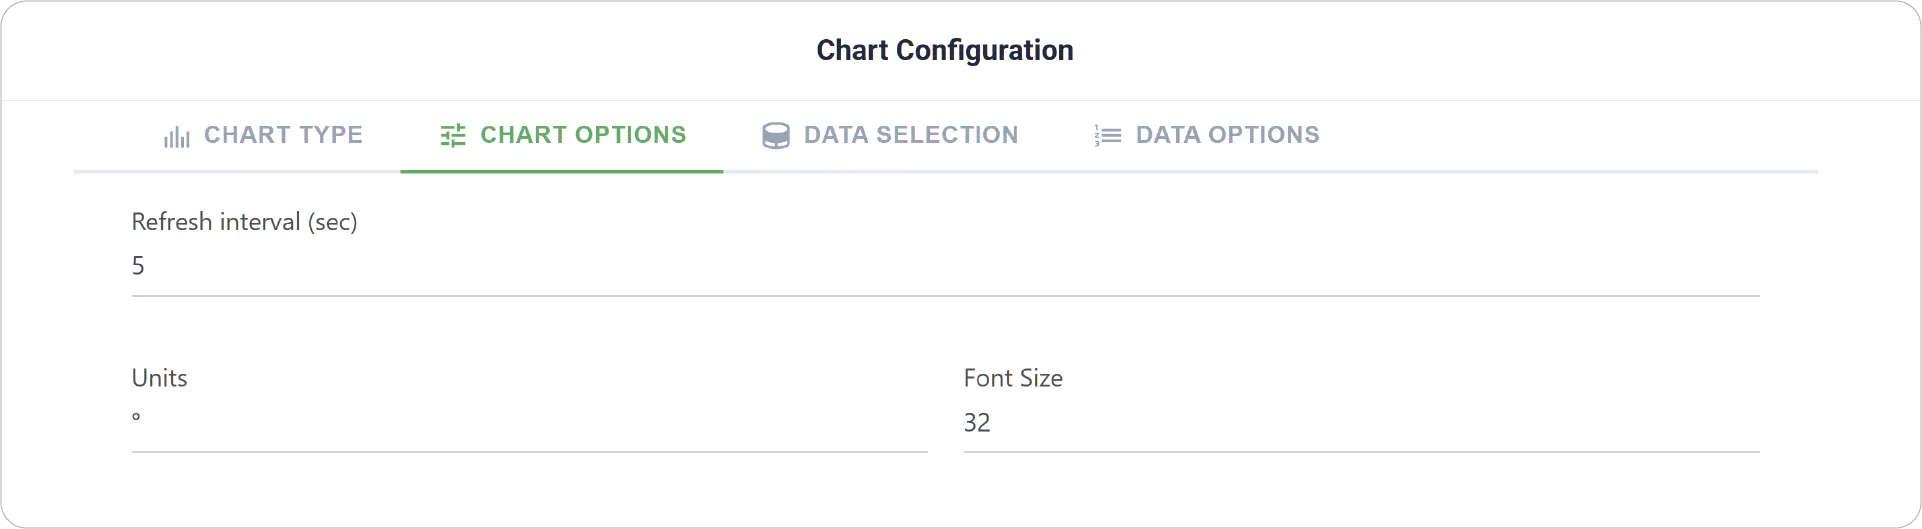
- Chart Options: Adjust visual settings such as font size to improve readability.
- Create Group Settings: Available when Create Group is enabled. Set Label Font Size for each grouped Compass Chart.
- Link Dashboard: Enable to link this chart to another dashboard.
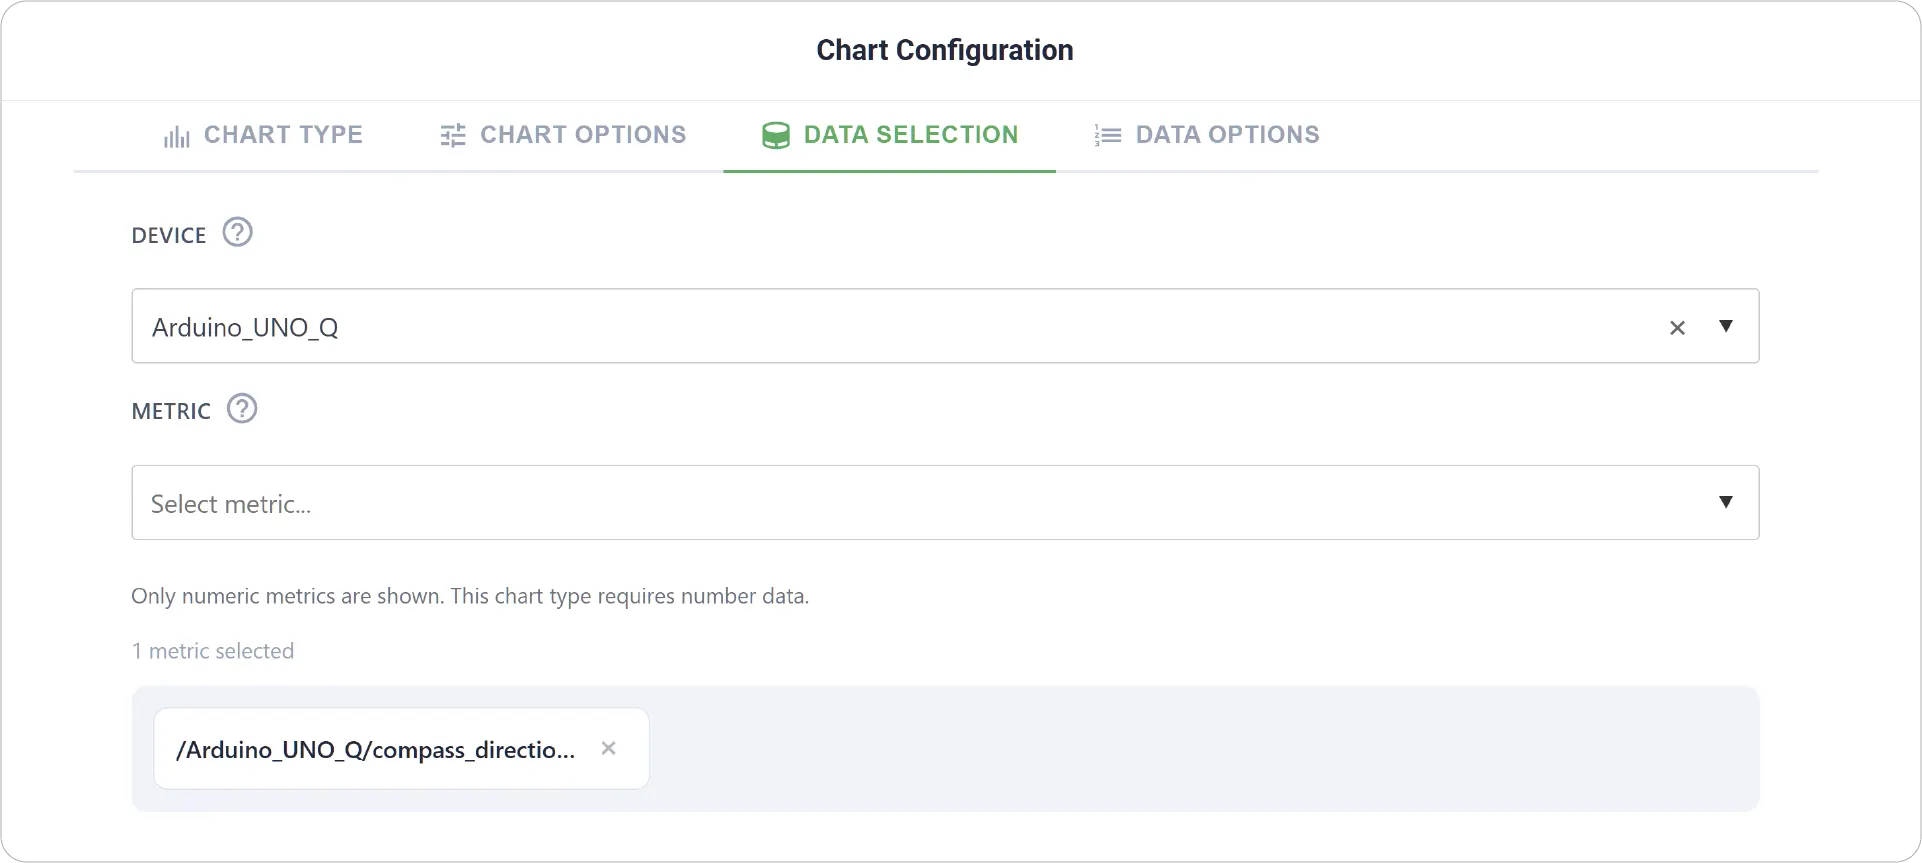
- Data Selection: Choose the device and select the metric representing directional data (e.g., angle, heading, or orientation).
- Add Item: Available when grouping is enabled, allowing addition of multiple Compass Charts along with Min-Max Values, Units, Fill Color, and Threshold settings for each Metric.
- Data Options: Not applicable for the Compass Chart.
Real-World Examples
-
Device Orientation Tracking
Monitor the direction a device is facing, such as a mobile device or IoT sensor.
-
Navigation and Movement Systems
Display heading or direction for GPS-enabled systems or moving equipment.
-
Wind Direction Monitoring
Visualize wind direction data in environmental or weather monitoring systems.
Add directional awareness to your dashboards with the Compass Chart. Explore other chart types to continue building rich and insightful visualizations.
Need help? Contact our support team: support@machinechat.io