JEDI's Circular Gauge Chart
A Circular Gauge Chart is a single-metric visualization that displays the current value of a metric within a fully circular (360°) dial. It provides a compact and visually engaging way to represent how a value compares against defined minimum and maximum limits.
Key Features
-
Full circular display
Uses a 360° dial for a complete visual representation of the metric range
-
Single-metric focus
Highlights one chosen key metric
-
Configurable min/max range
Clearly shows where the current value falls within set limits
-
Compact and intuitive
Easy to interpret at a glance
Configuration
Circular Gauge Chart for Grid Dashboard
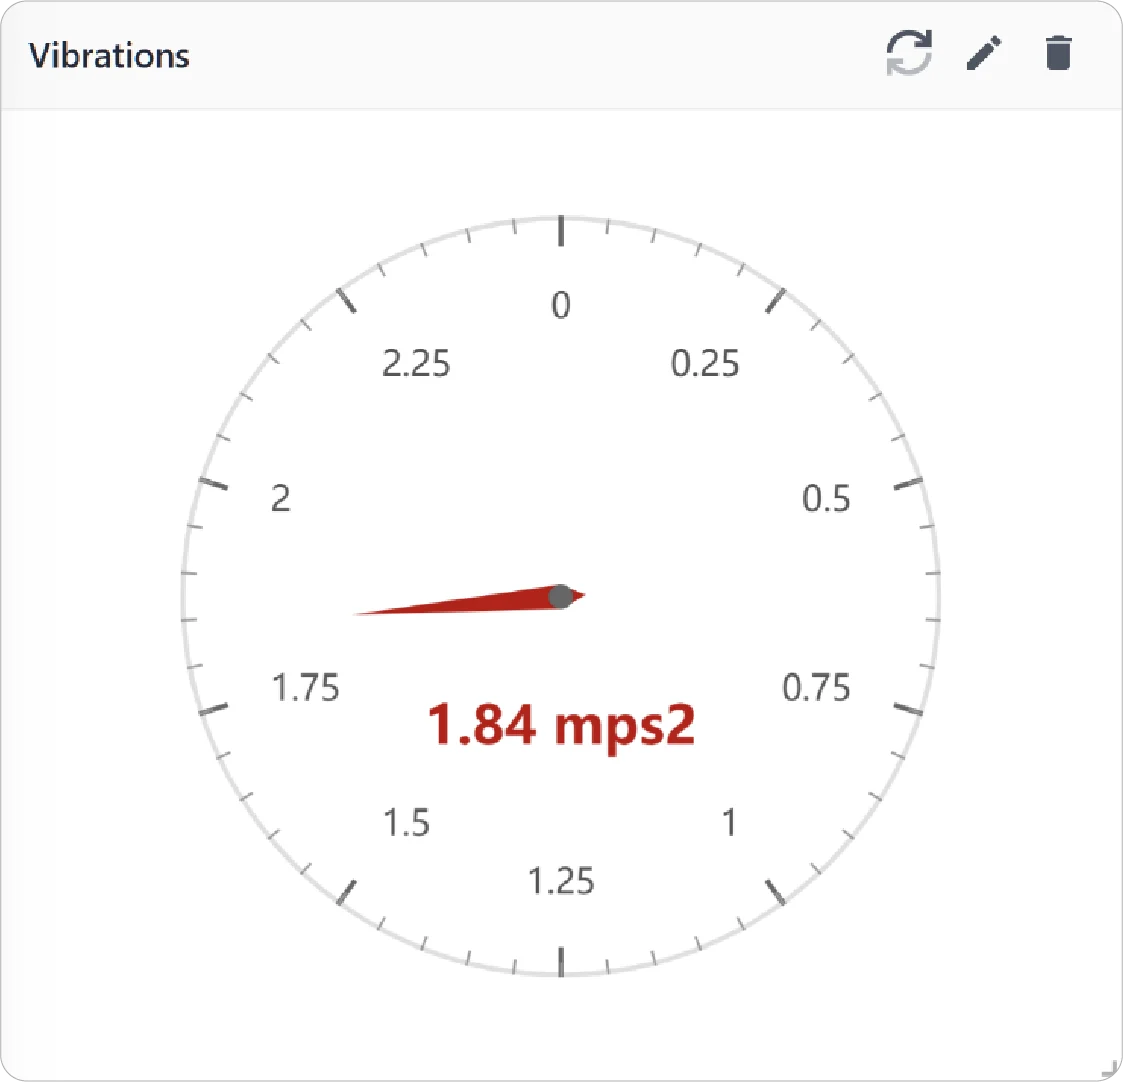
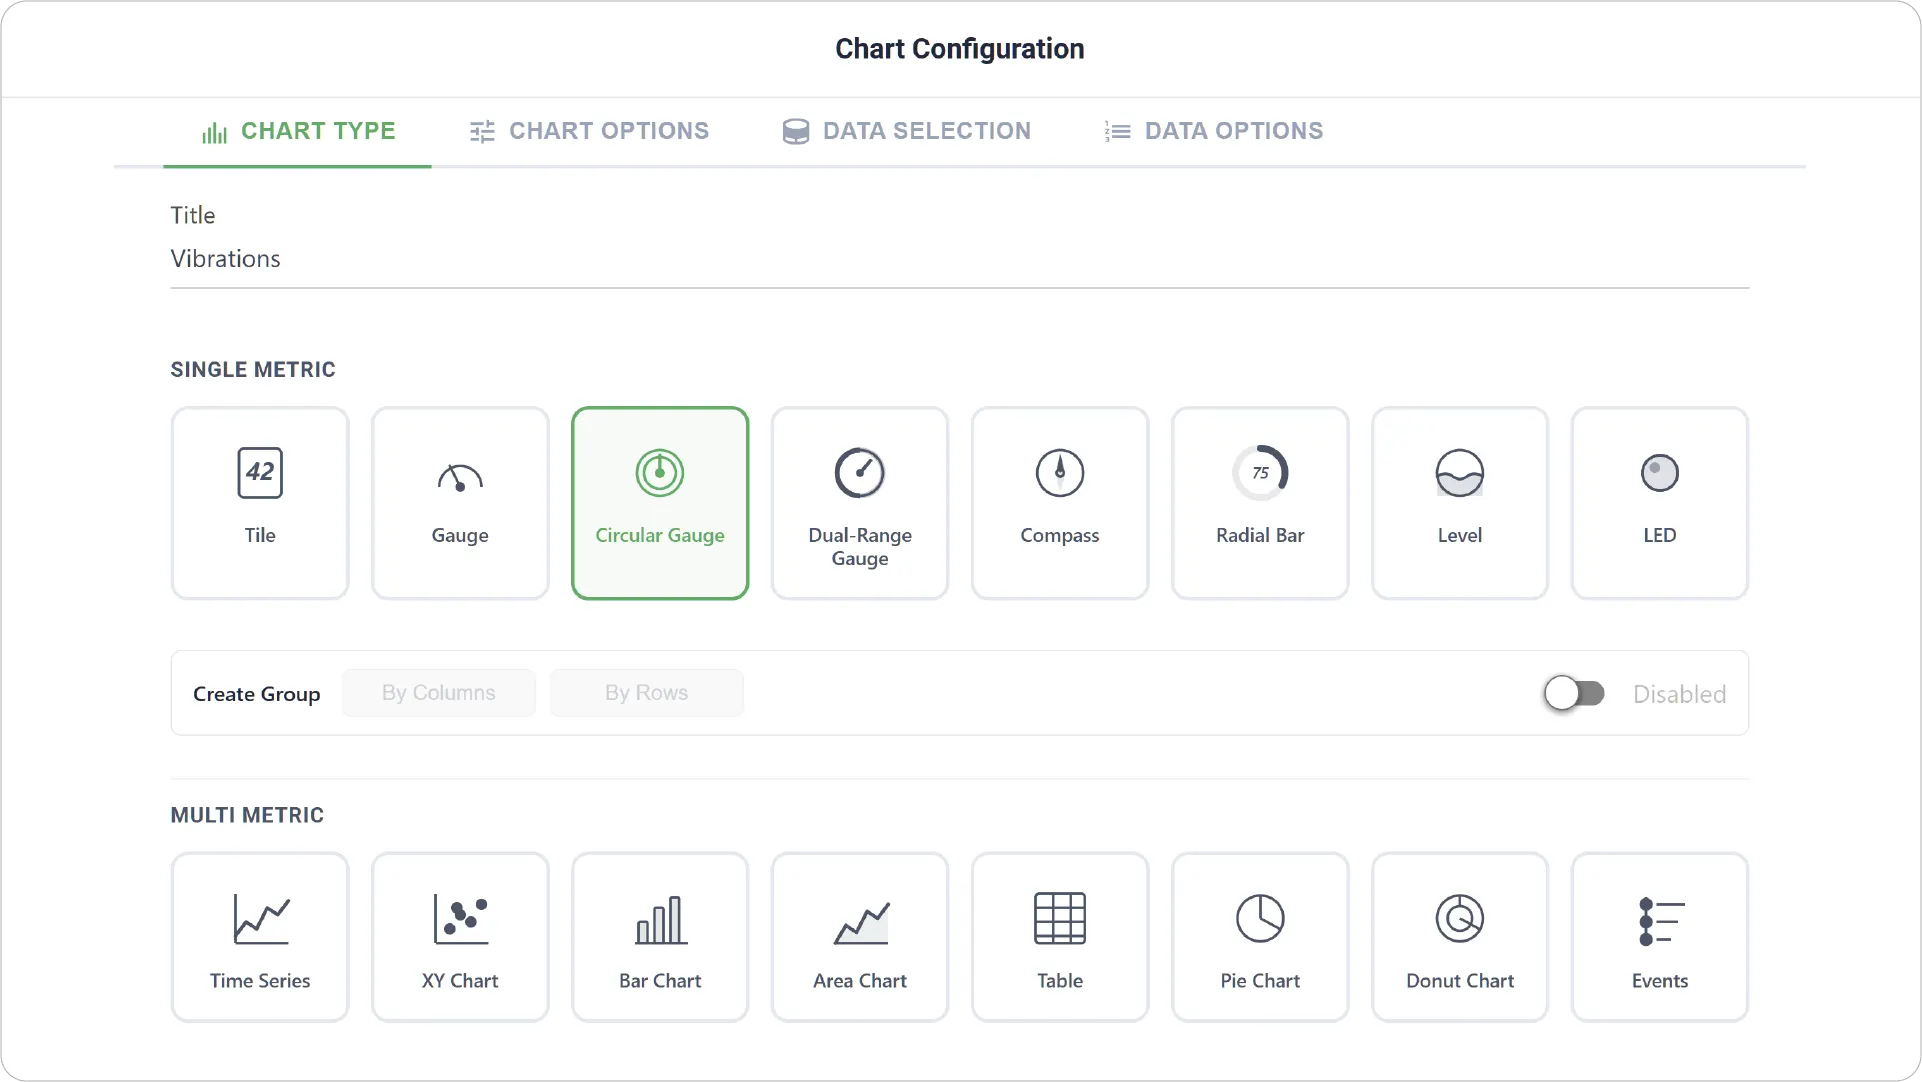
- Chart Type: Select the Circular Gauge Chart type and provide a title for your chart.
- Enabling Create Group allows you to add more than one Circular Gauge.
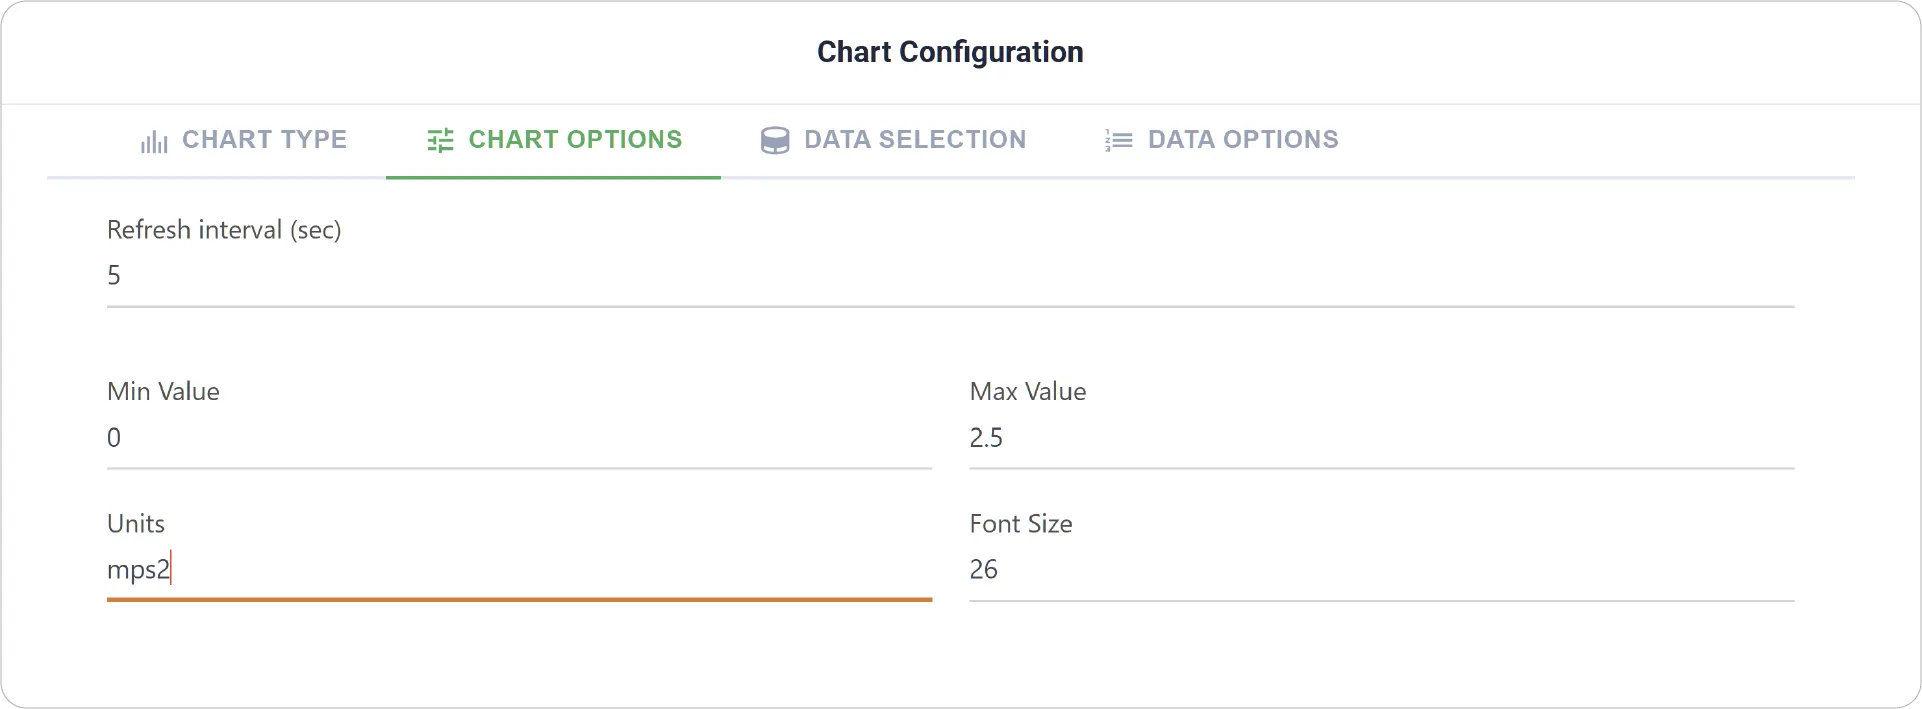
- Chart Options: Configure visual elements such as font size and units, and define minimum and maximum values for the gauge range.
- Create Group Settings: Available when Create Group is enabled. Set Label Font Size for each grouped Circular Gauge Chart.
- Link Dashboard: Enable to link this chart to another dashboard.
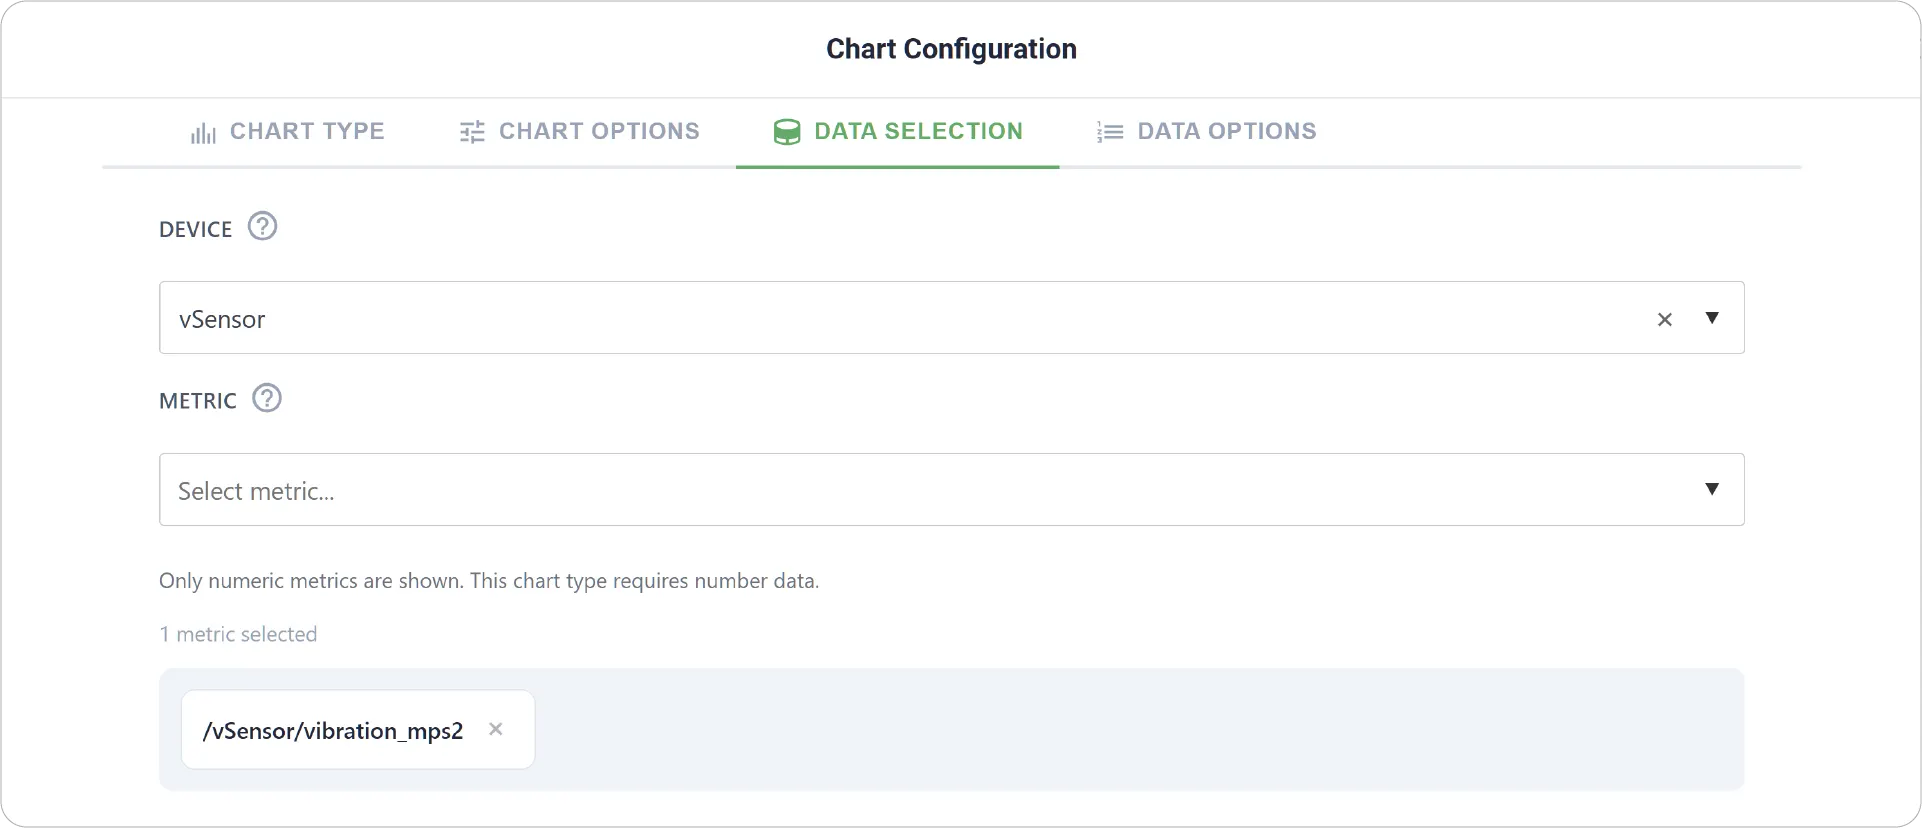
- Data Selection: Choose the device and select a single metric to display in the chart.
- Add Item: Available when grouping is enabled, allowing addition of multiple Circular Gauge Charts along with Min-Max Values, Units, Fill Color, and Threshold settings for each Metric.
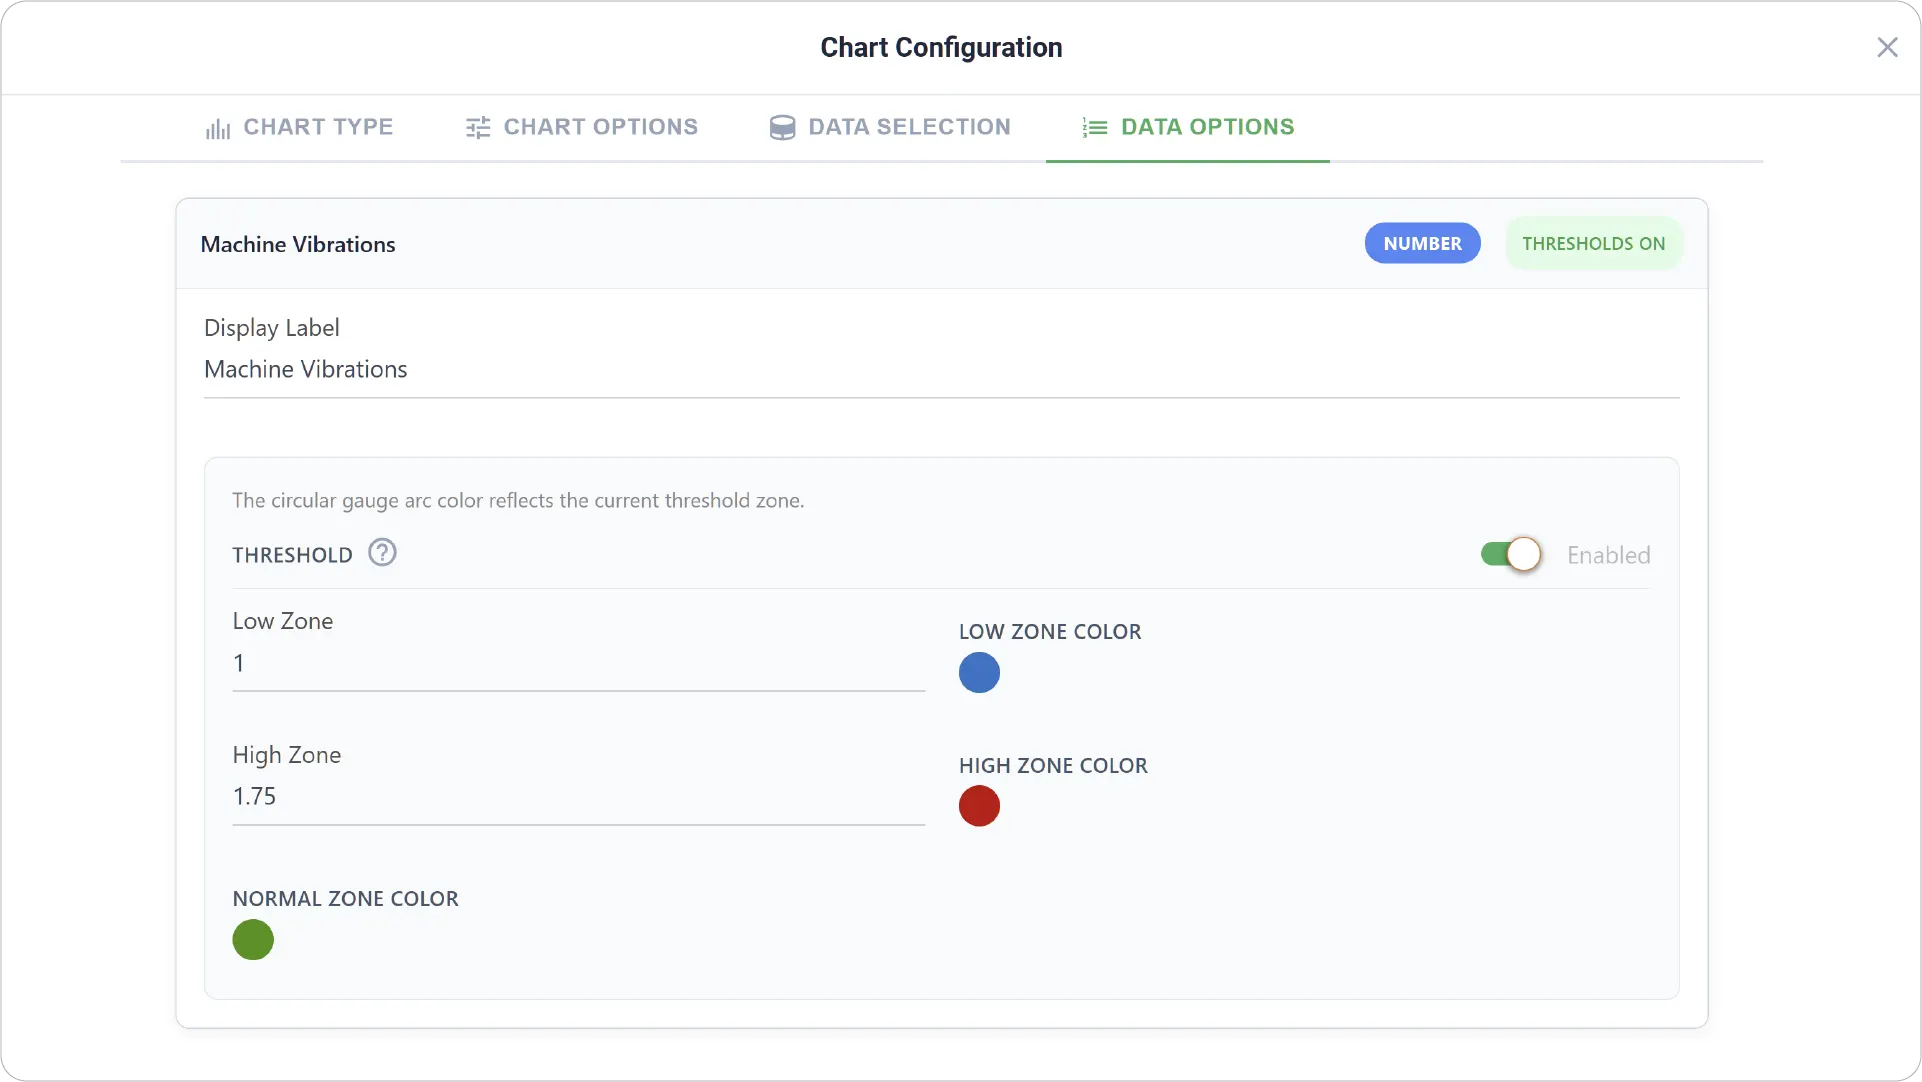
- Data Options: Customize how the data is presented, including display labels and configuring threshold zones (e.g., defining low and high ranges with corresponding color indicators).
- Data Options are not available when Create Group is enabled.
Real-World Examples
-
Battery Level Monitoring
Display battery percentage with clear low (critical) and high (fully charged) zones.
-
Temperature Control Systems
Monitor temperature ranges with defined low and high thresholds for safe operation.
-
Resource Utilization Tracking
Visualize metrics like CPU or memory usage within a full range to quickly assess load levels.
Make your key metrics stand out with the Circular Gauge Chart. Explore additional chart guides to build powerful dashboards.
Need help? Contact our support team: support@machinechat.io