JEDI's Dual-Range Gauge Chart
A Dual-Range Gauge Chart is a single-metric visualization that displays a value across two distinct ranges within the same gauge. This allows you to represent different operating zones or scales, making it easier to interpret metrics that have dual thresholds or phases.
Key Features
-
Dual-range visualization
Displays two distinct ranges within a single gauge
-
Defined min/max values
Clearly represents the full scale of the metric
-
Improved context
Helps interpret values that behave differently across ranges
-
Real-time updates
Reflects the latest value of the selected metric
Configuration
Dual-Range Gauge Chart for Grid Dashboard
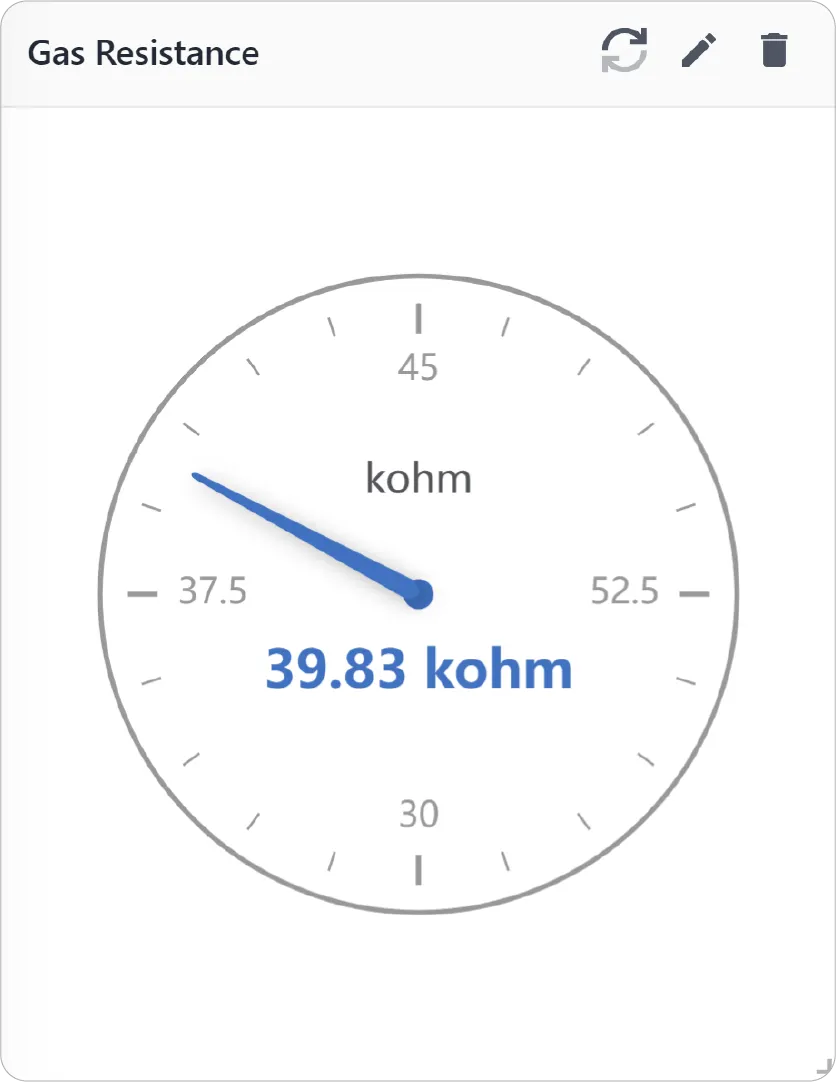
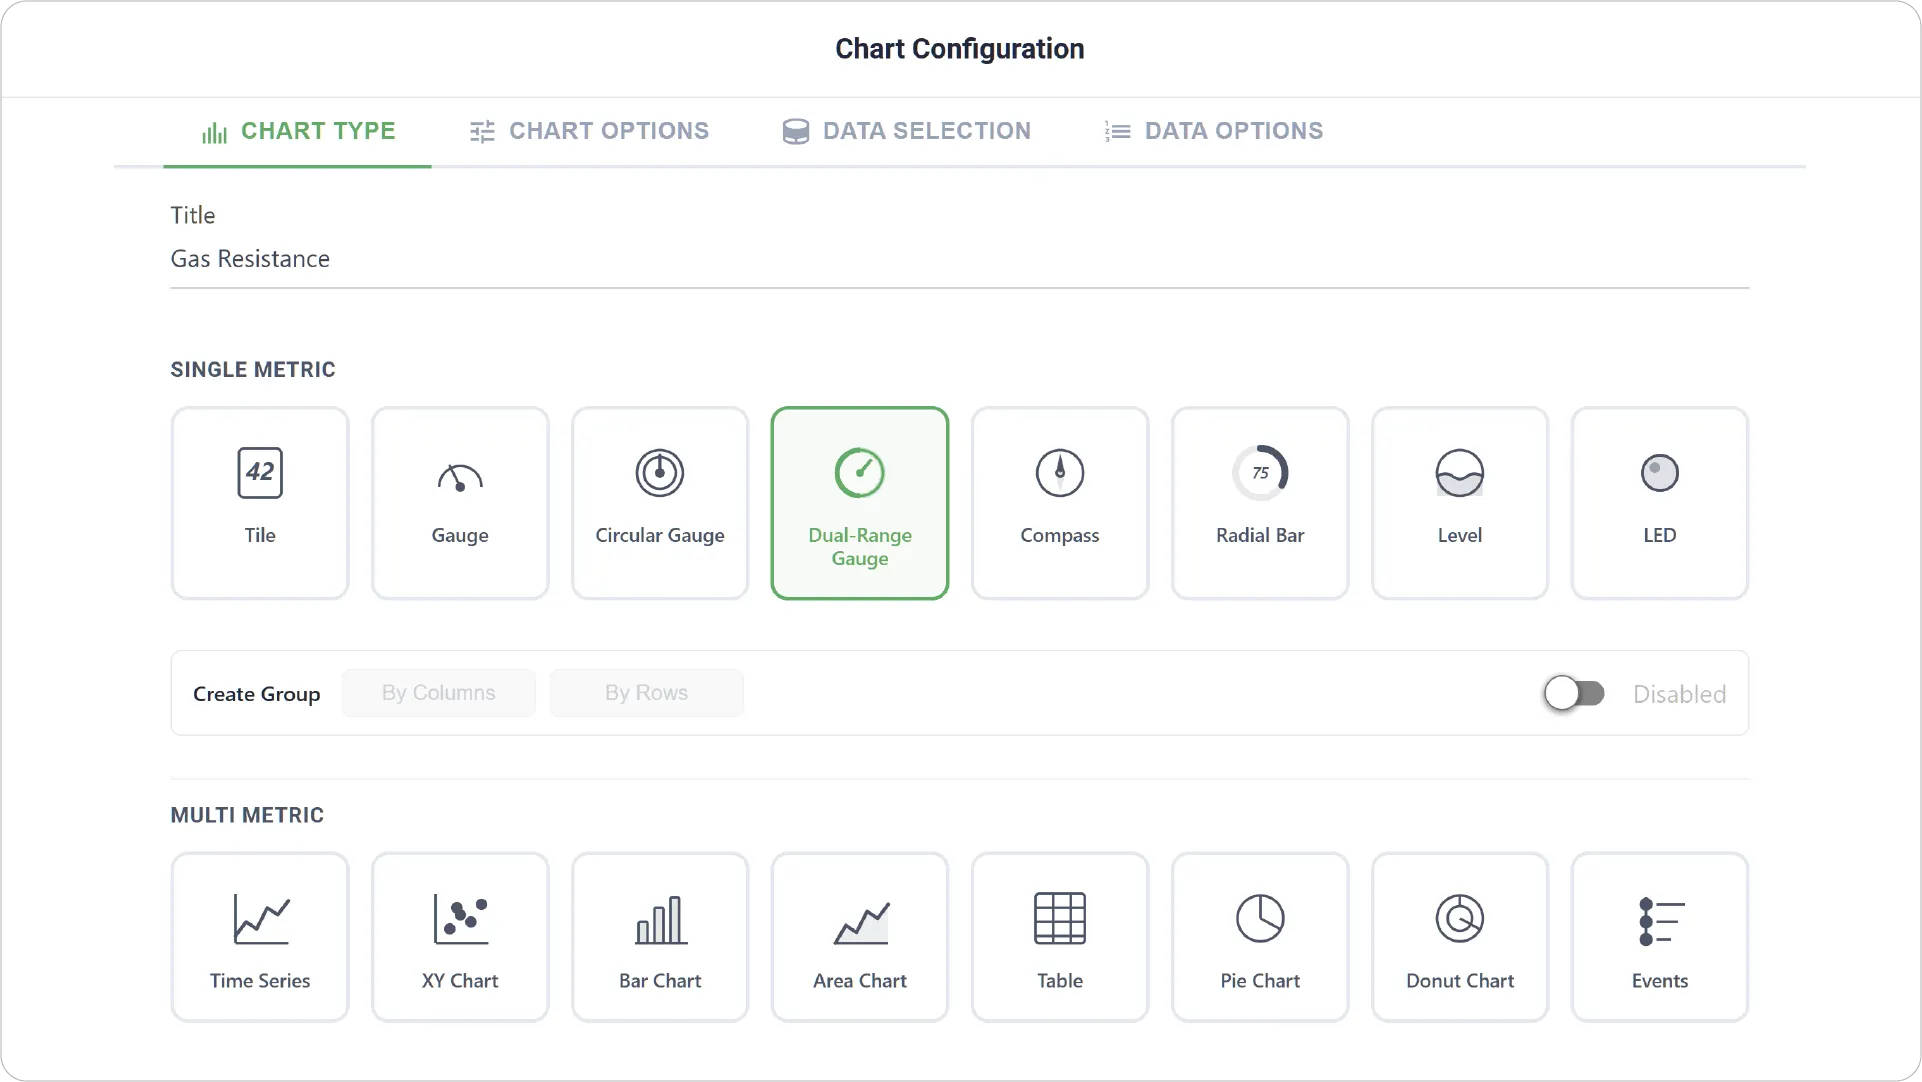
- Chart Type: Set chart title and select Dual-Range Gauge as the chart type.
- Enabling Create Group allows you to add more than one Dual-Range Gauge.
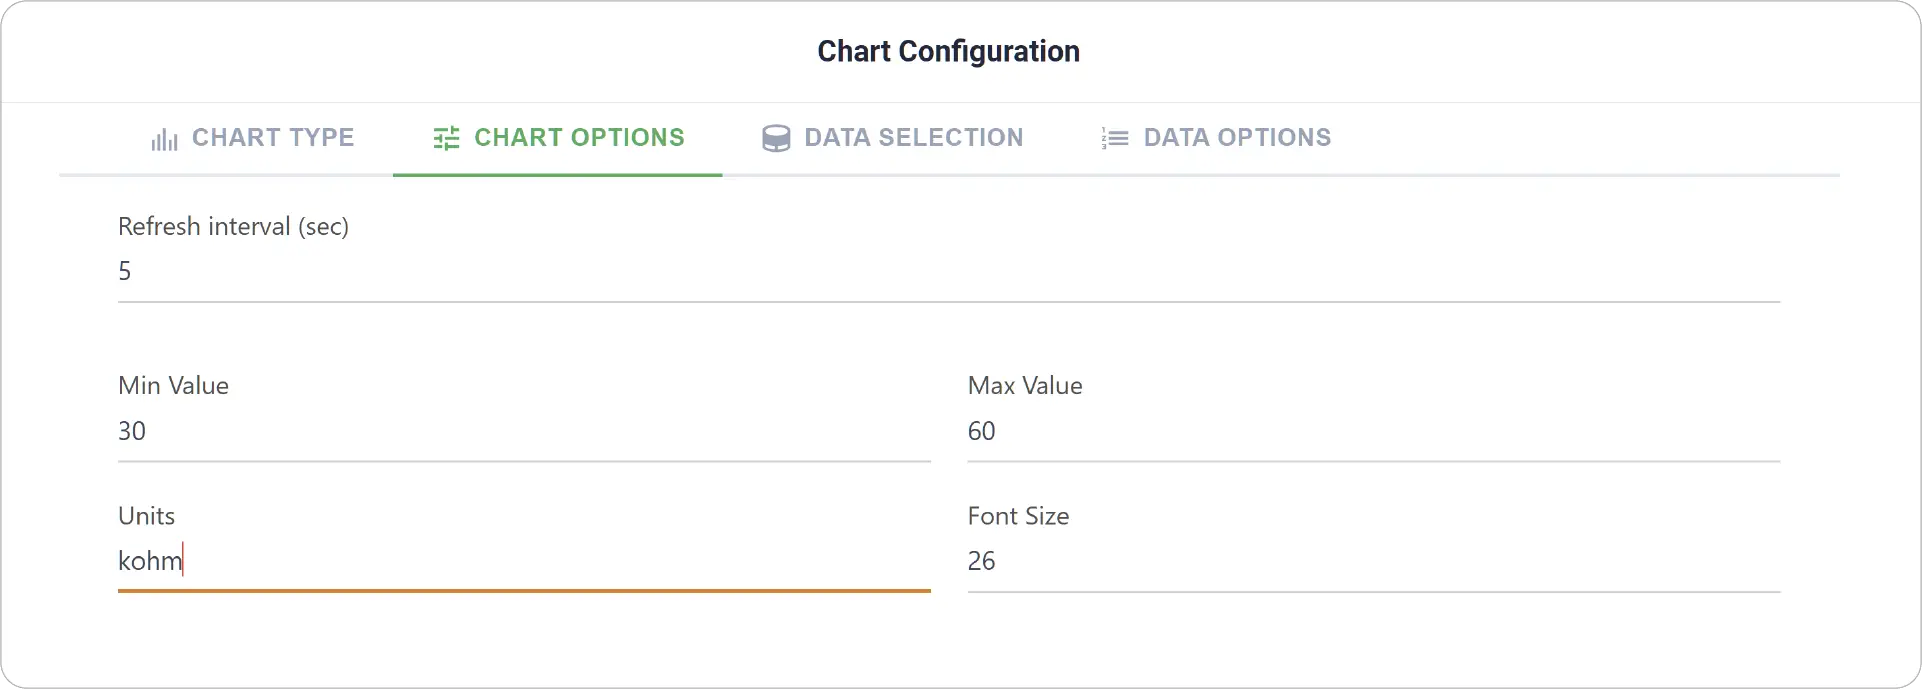
- Chart Options: Configure font style and size, set measurement units, and define minimum and maximum gauge values.
- Create Group Settings: Available when Create Group is enabled. Set Label Font Size for each grouped Dual-Range Gauge Chart.
- Link Dashboard: Enable to link this chart to another dashboard.
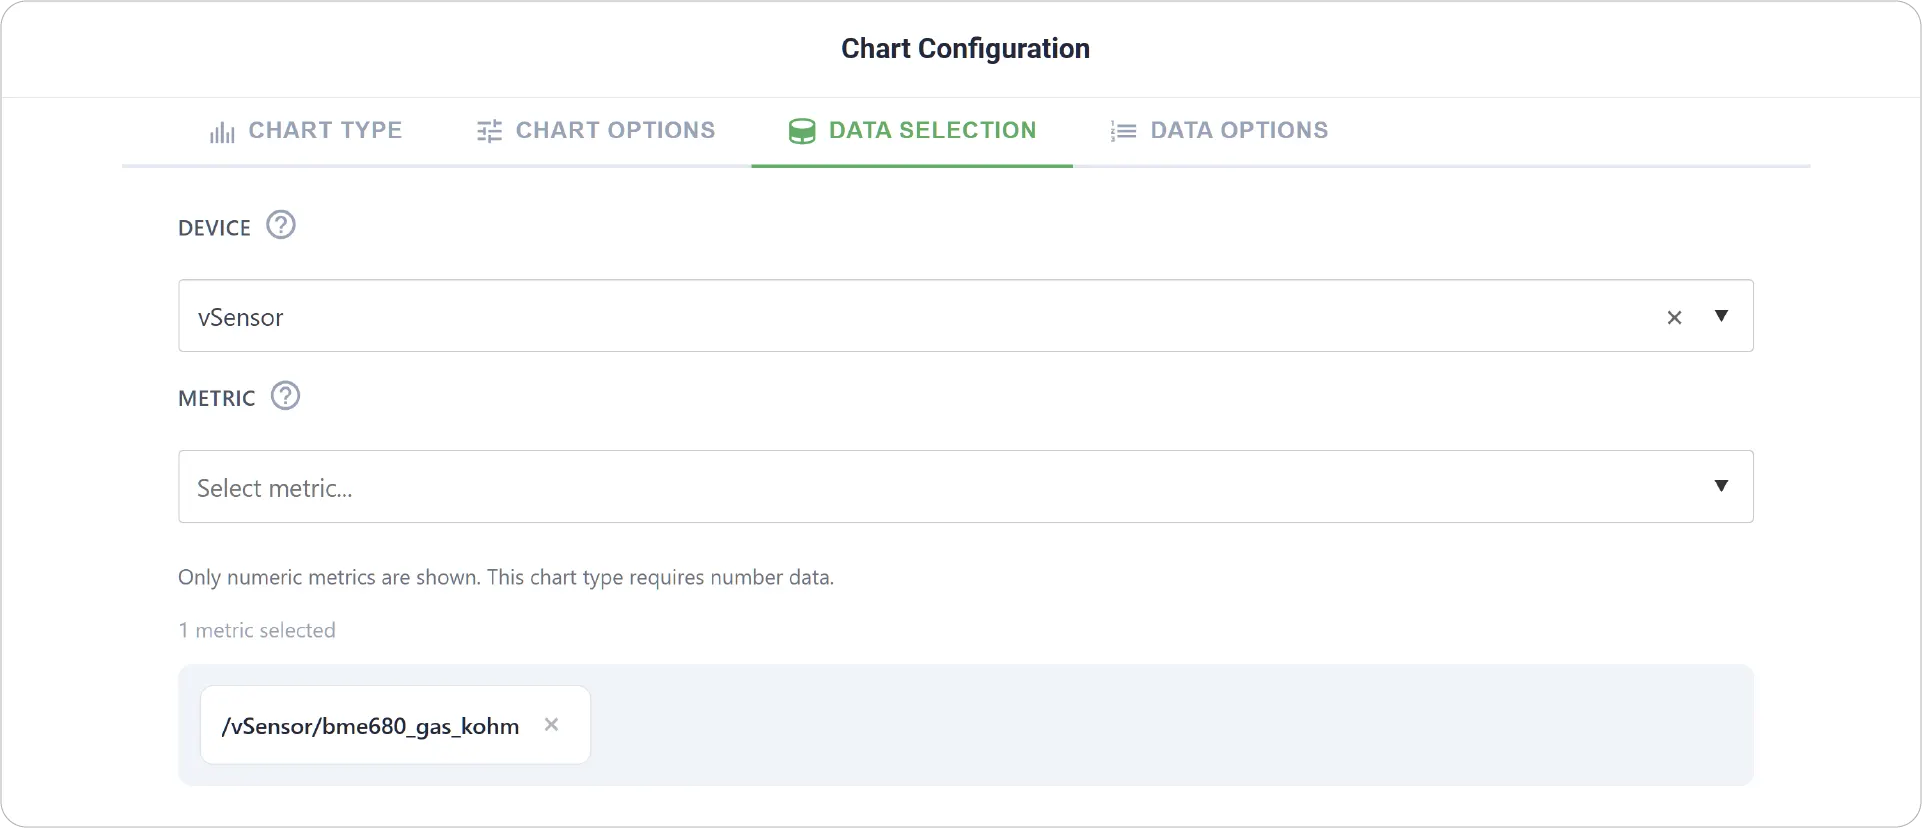
- Data Selection: Select the device and the specific metric to be displayed.
- Add Item: Available when grouping is enabled, allowing addition of multiple Dual-Range Gauge Charts along with Min-Max Values, Units, Fill Color, and Threshold settings for each Metric.
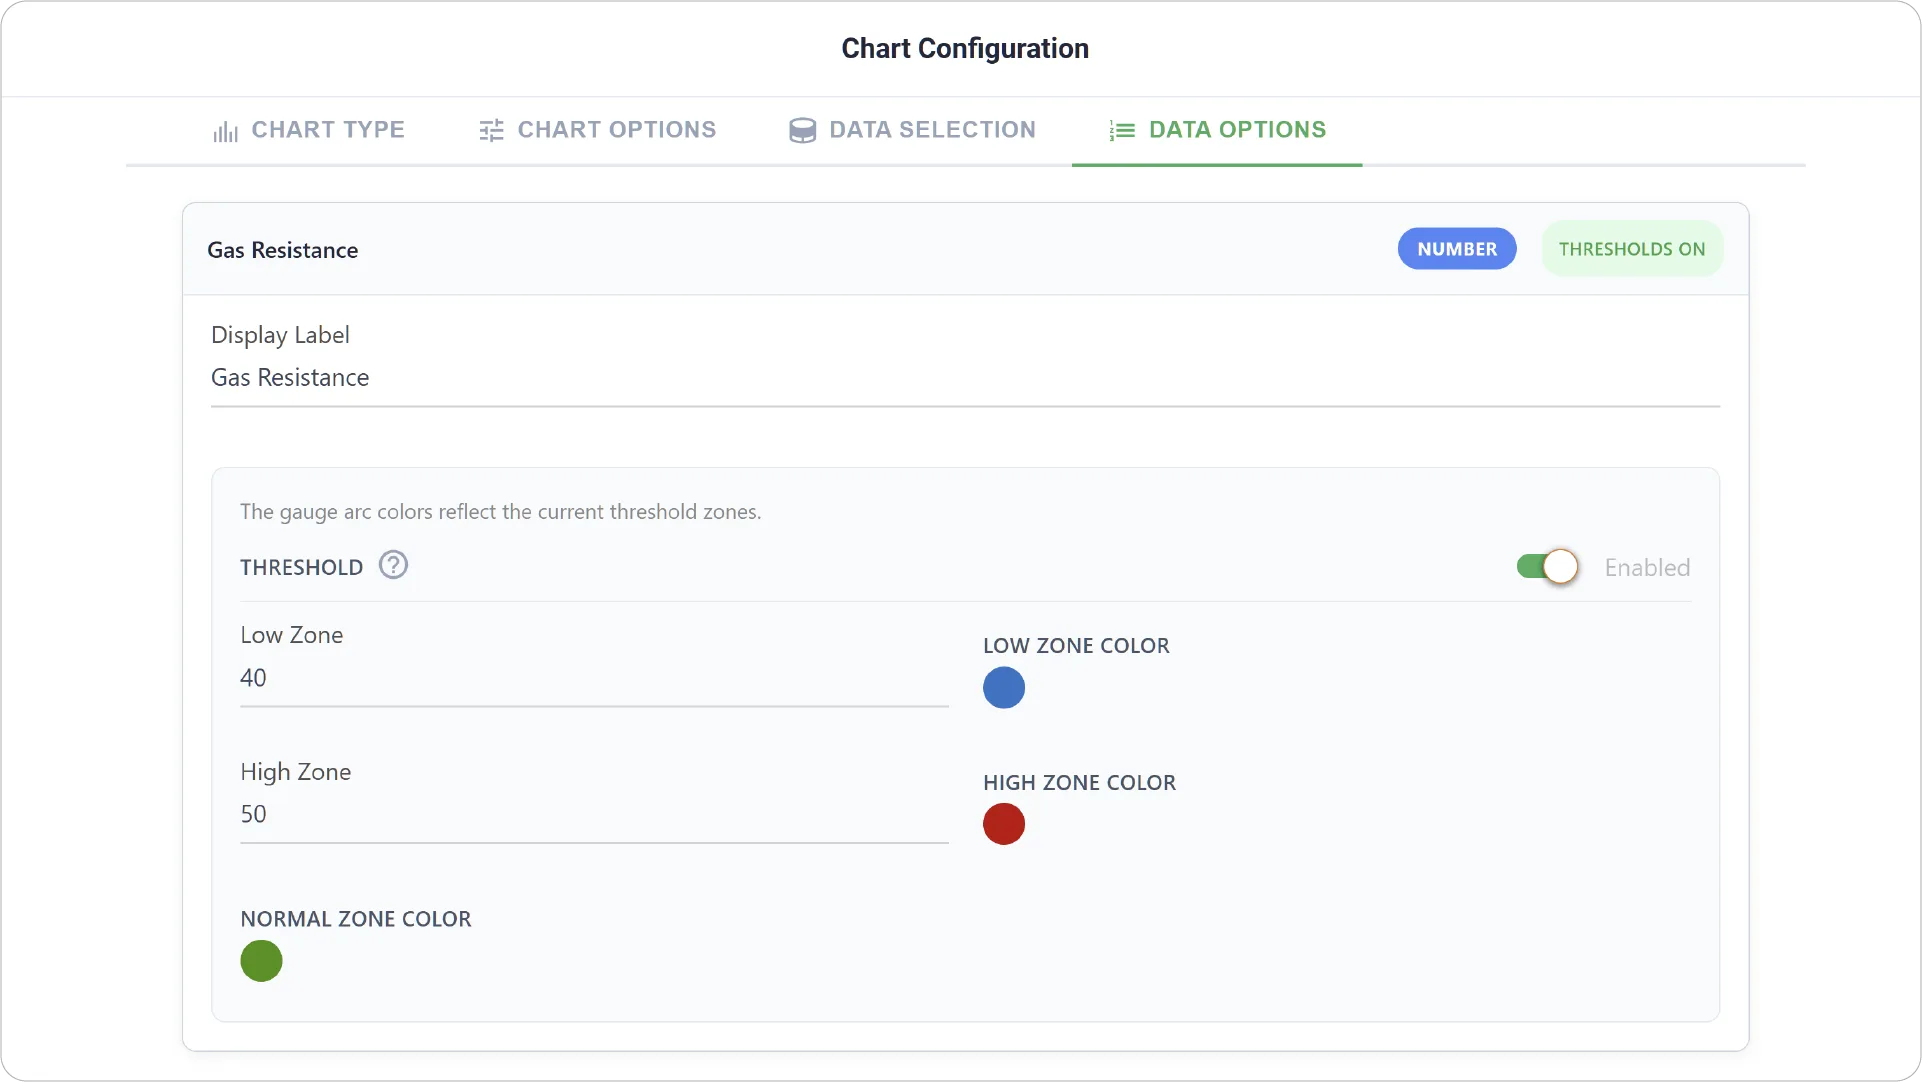
- Data Options: Configure display settings and define threshold ranges for low and high zones with assigned colors.
- Data Options are not available when Create Group is enabled.
Real-World Examples
-
Temperature Monitoring with Critical Zones
Track temperature where one range represents normal operation and another highlights critical overheating conditions.
-
Speed or RPM Tracking
Visualize machine speed with separate ranges for optimal performance and overdrive or stress conditions.
-
Energy Consumption Levels
Monitor energy usage across normal and peak demand ranges to quickly identify excessive consumption.
Add deeper context to your dashboards with the Dual-Range Gauge Chart. Explore additional chart guides to build powerful dashboards.
Need help? Contact our support team: support@machinechat.io