Visualize What Happened, When It Happened with JEDI's Events Chart
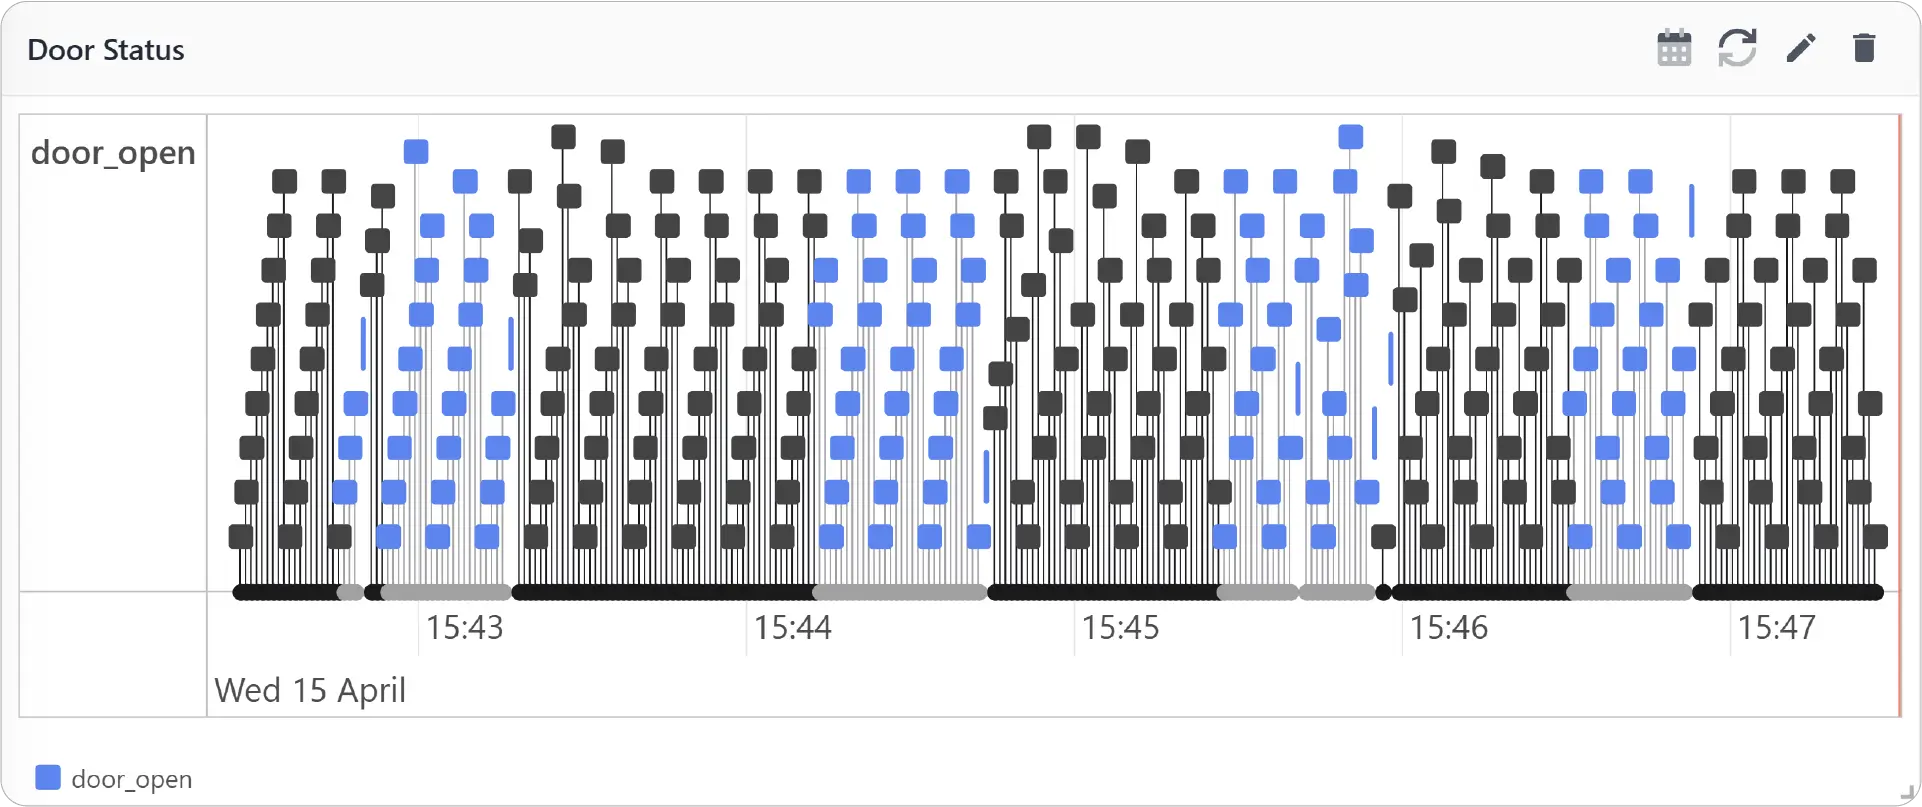
Events Chart provides a multi-metric visualization designed to display occurrences of event-based or boolean metrics over time. It helps you track when specific states change, such as on/off events, alerts, or system triggers.
This chart is especially useful for understanding the timing, frequency, and overlap of multiple events within a system.
Key Features
-
Event-Based Visualization
Clearly displays when events occur over time
-
Time-Aligned Representation
Aligns all events along a shared timeline for easy correlation
-
State Change Visibility
Highlights transitions such as ON/OFF or TRUE/FALSE states
-
Stacked Event Views
Allows vertical or horizontal stacking for better comparison
Configuration
Events Chart for Grid Dashboard
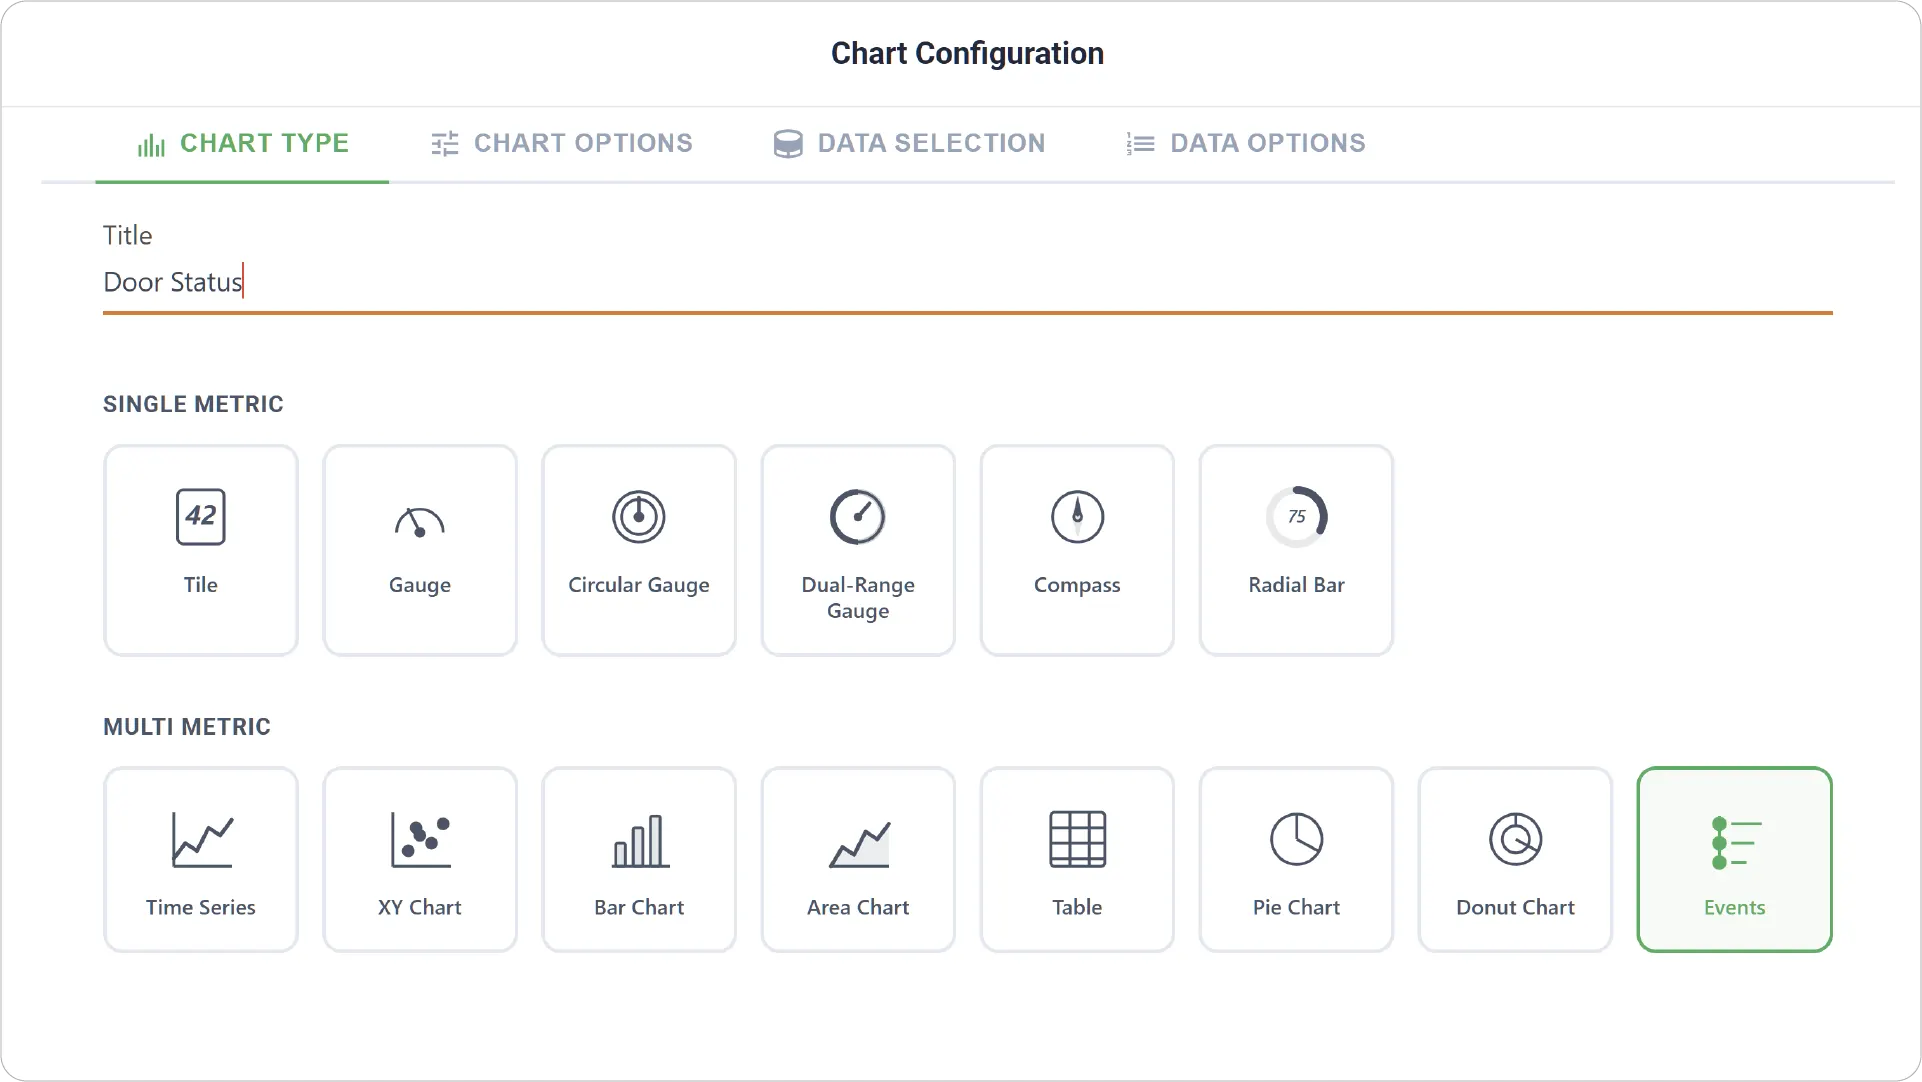
- Chart Type: Select the Events Chart type and provide a title for your chart.
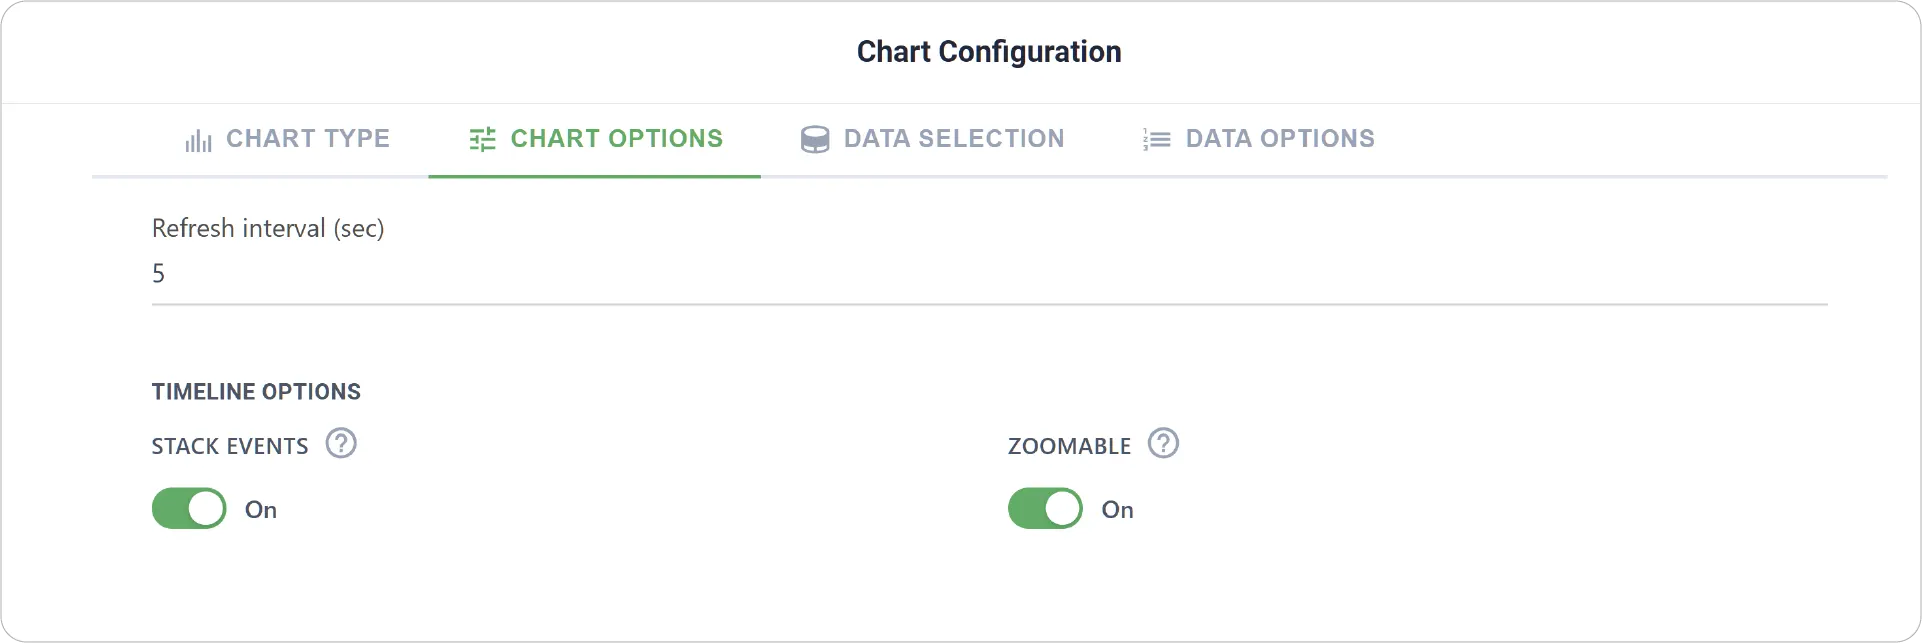
- Chart Options: Configure visual elements such as stack orientation (vertical or horizontal) and zooming.
- Enable Link Dashboard to link this chart to another dashboard.
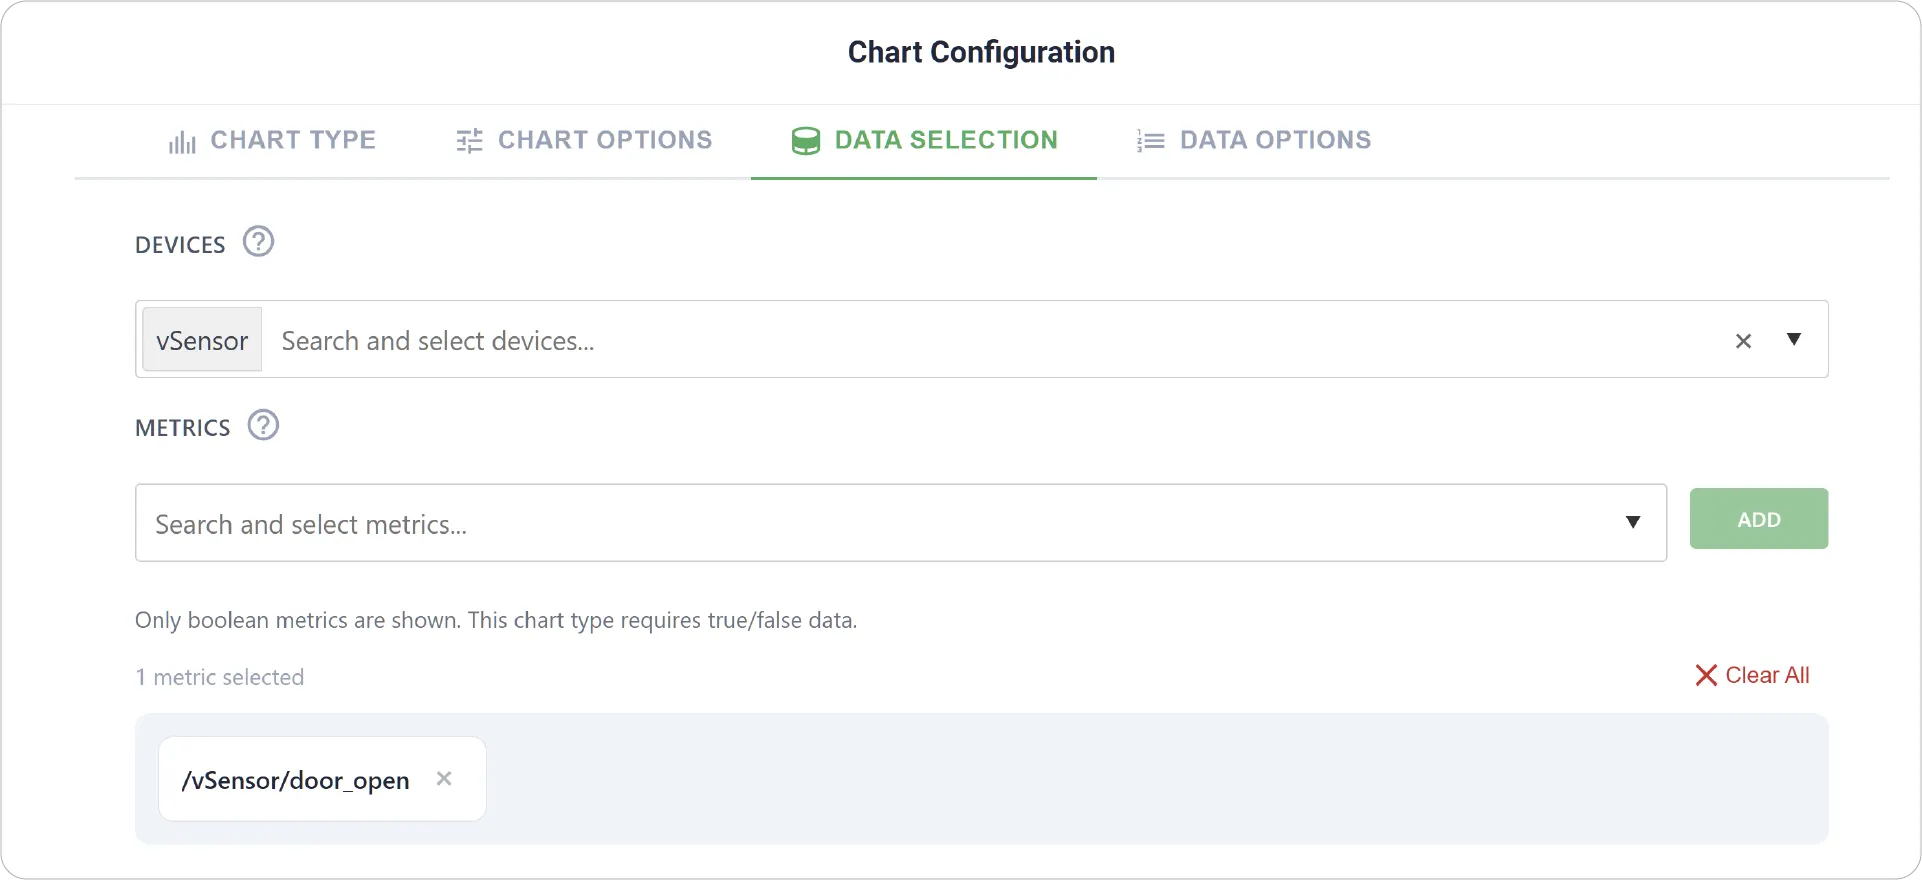
- Data Selection: Choose the device and select relevant boolean or event-based metrics.
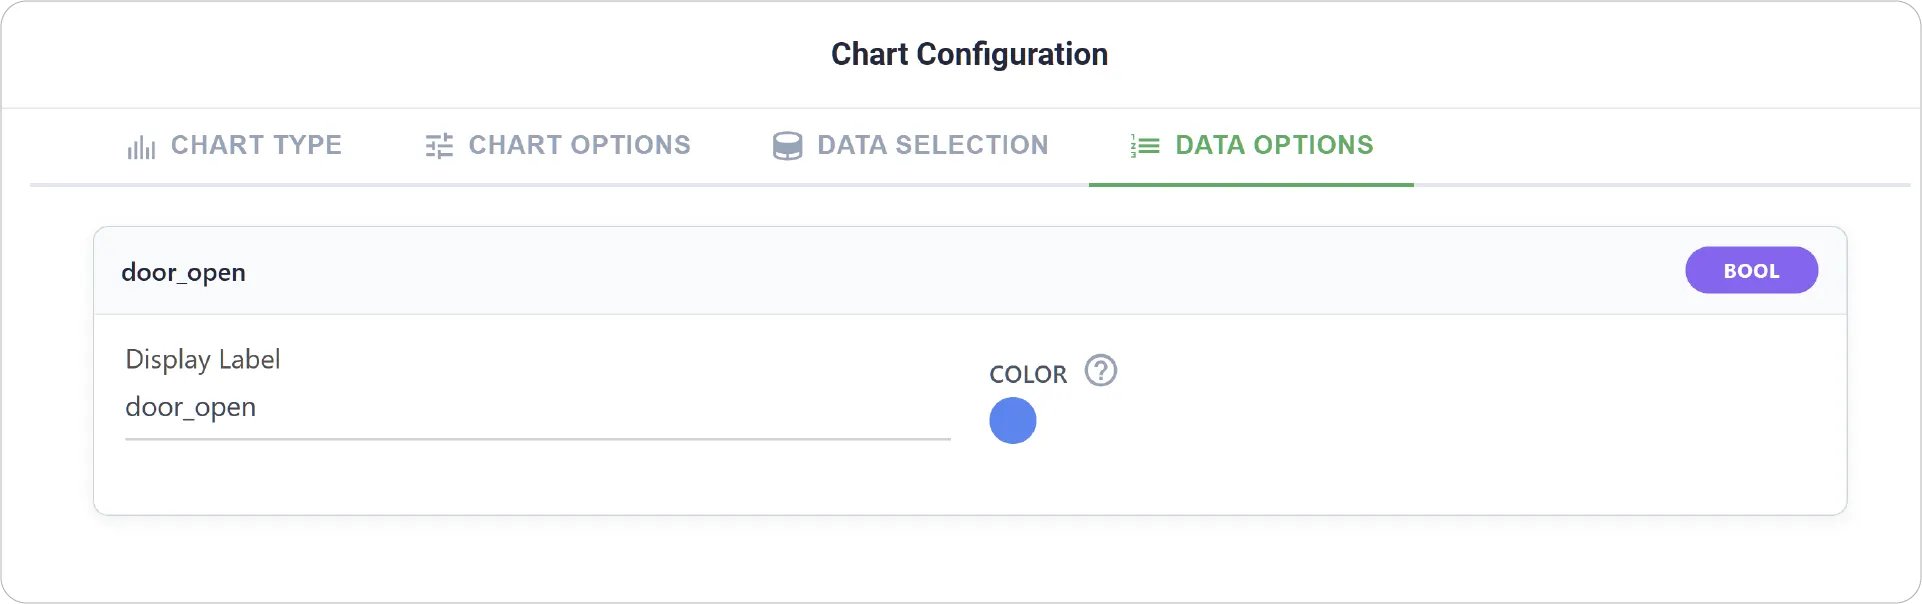
- Data Options: Customize with display labels and distinct colors for each event metric.
Real-World Examples
-
System Status Monitoring
Track device states such as online/offline, active/inactive, or running/stopped.
-
Alert and Alarm Tracking
Visualize when alerts are triggered and cleared across multiple systems.
-
Process Event Sequencing
Analyze the order and overlap of events in industrial or automated workflows.
Gain better visibility into system activity with the Events Chart. Explore other chart types to build even more powerful and insightful dashboards.
Need help? Contact our support team: support@machinechat.io