Dashboard Types in Machinechat JEDI
JEDI offers three powerful dashboard types: Grid, Table, and Web App. Each dashboard type is designed to support different ways of visualizing and interacting with your data.
Grid Dashboard
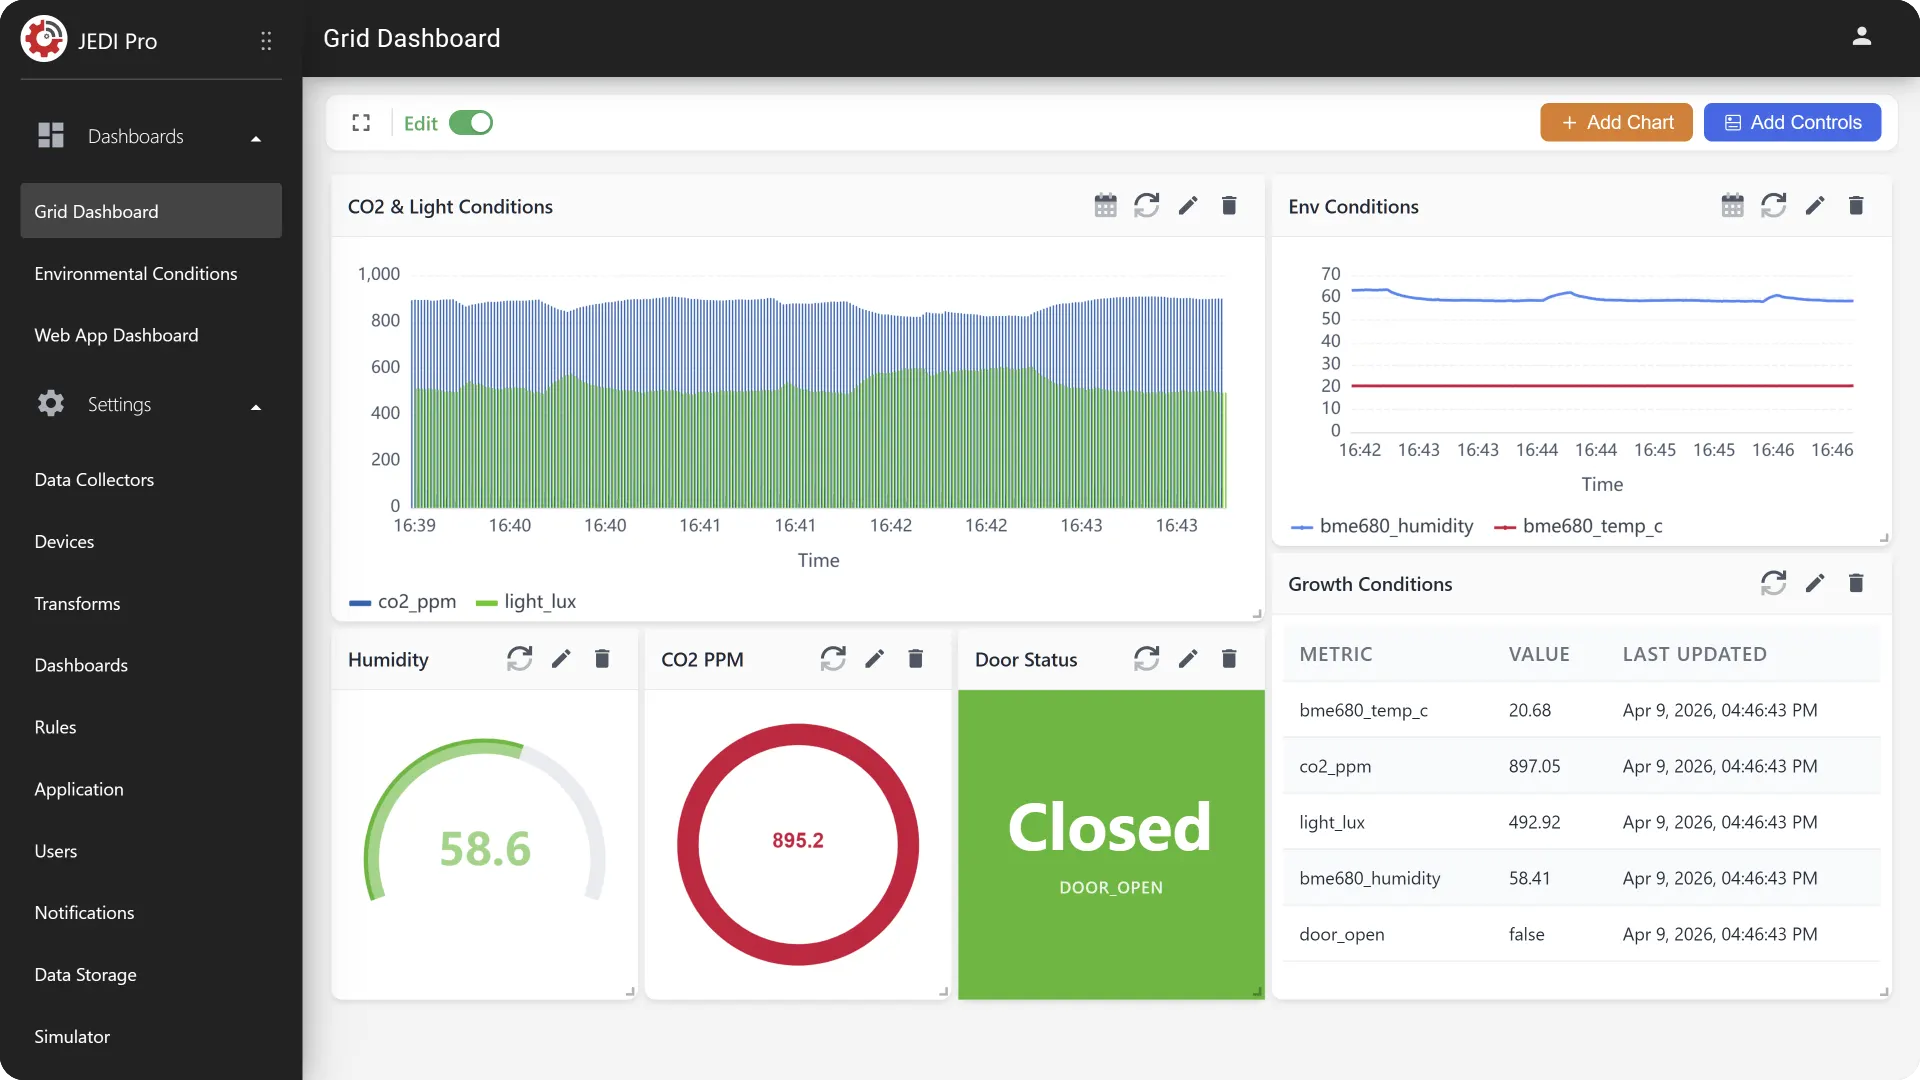
The Grid Dashboard allows you to build dashboards tailored to your specific monitoring and operational needs with customizable layout of visualizations and controls.
Features
- Flexible Grid Layout: Design dashboards using a drag-and-drop grid system that allows you to position, resize, and organize charts for optimal visibility and usability.
- Charts and Controls:
- Single-Metric Visualizations: Display individual metrics using focused visual indicators such as Tiles, Gauges, and Radial Bars.
- Multi-Metric Visualizations: Visualize multiple metrics and trends using advanced chart types such as Time Series, Charts, Tables, and Events.
- Interactive Controls: Add control elements such as Toggles, Sliders, and Text Inputs directly to the dashboard to trigger changes in real time.
- Real-Time Visualization and Interaction: Charts are continuously updated with live data while allowing immediate user input through controls.
- Advanced Chart Features: Charts have individal features such as:
- Historical querying
- Data refresh
- Chart modification
- Deletion
- Platform Compatibility: Designed to work responsively on desktop, tablets, and mobile screens (with some chart setting limitations naturally arising due to screen size).
Use Cases
- Operations Monitoring and Response: Track system events and enable quick response through integrated control elements.
- Custom Workflow Dashboards: Build dashboards tailored to specific roles (e.g., operators, engineers, managers) with relevant data and controls.
- Interactive Prototyping: Rapidly build and test dashboard layouts with different visualizations and controls to prototype efficient workflows.
Rich Chart Settings and Historical Data Views
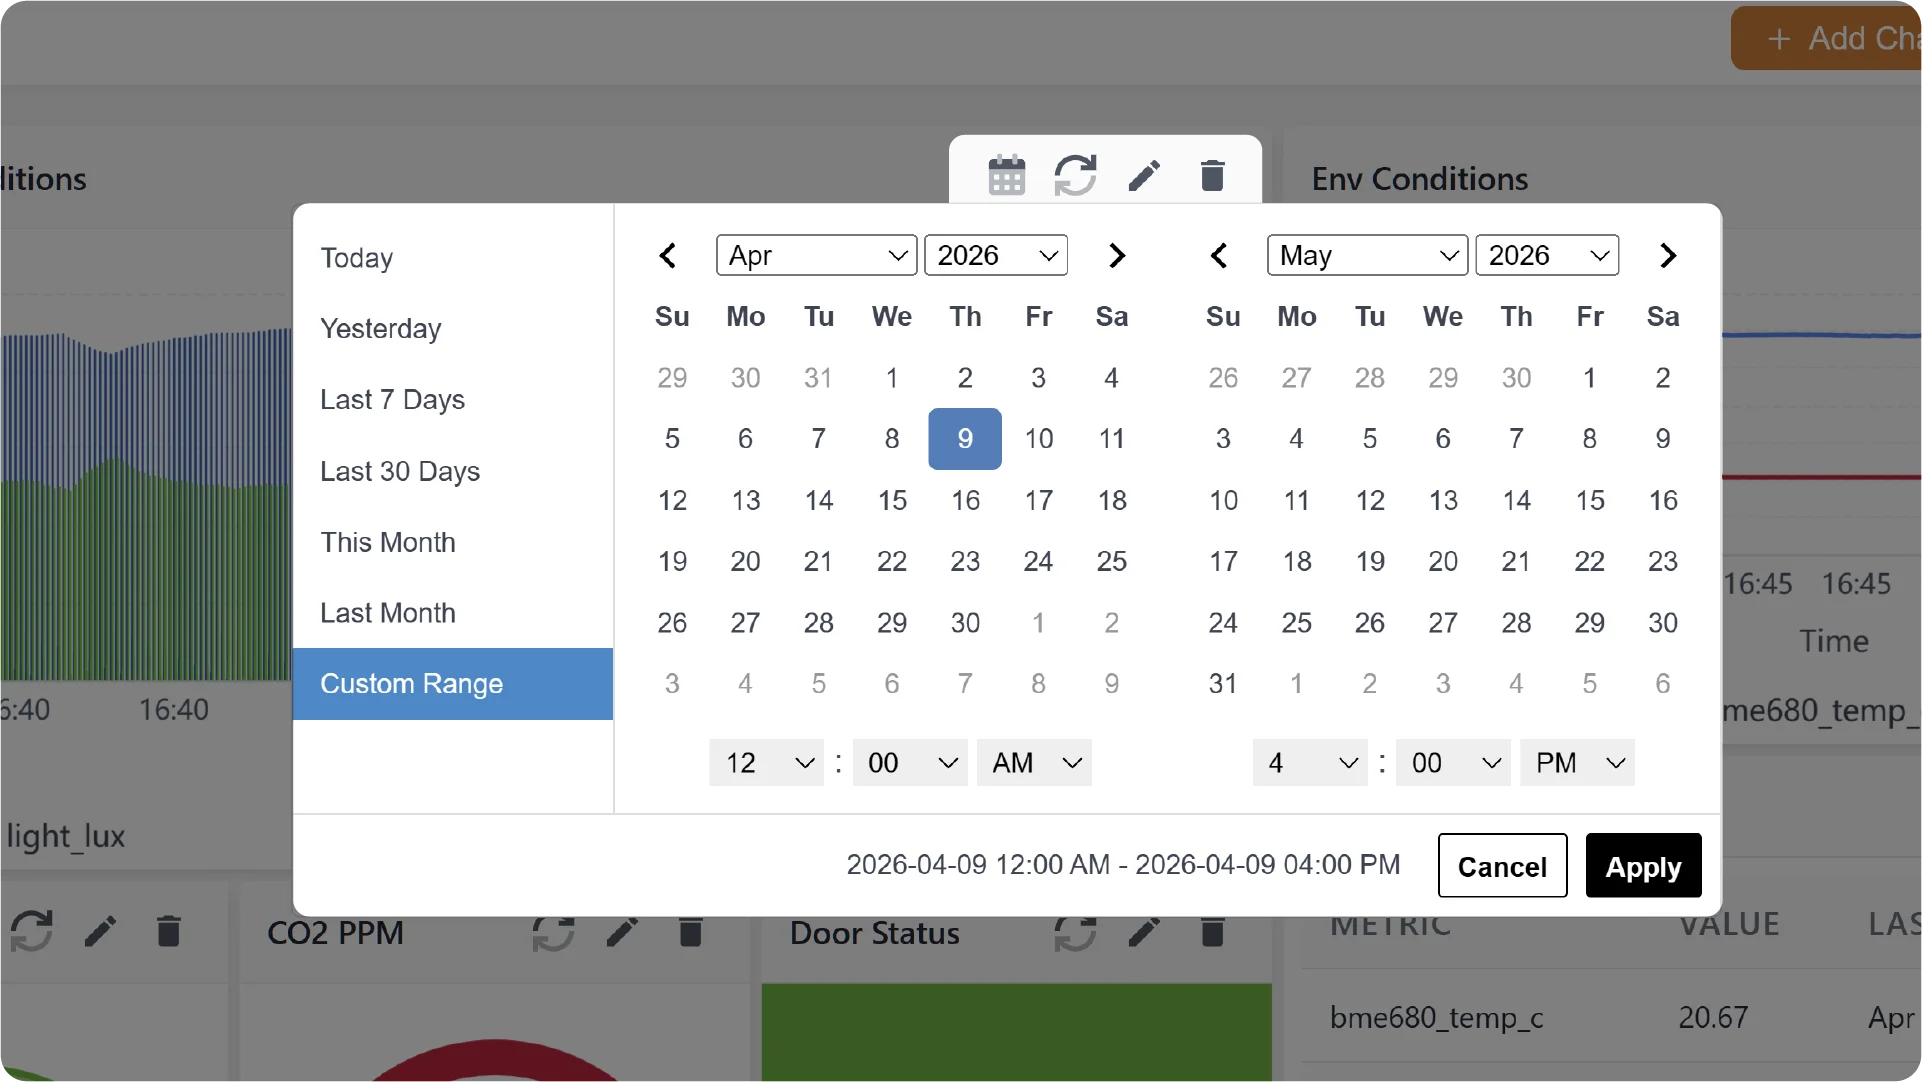
Table Dashboard
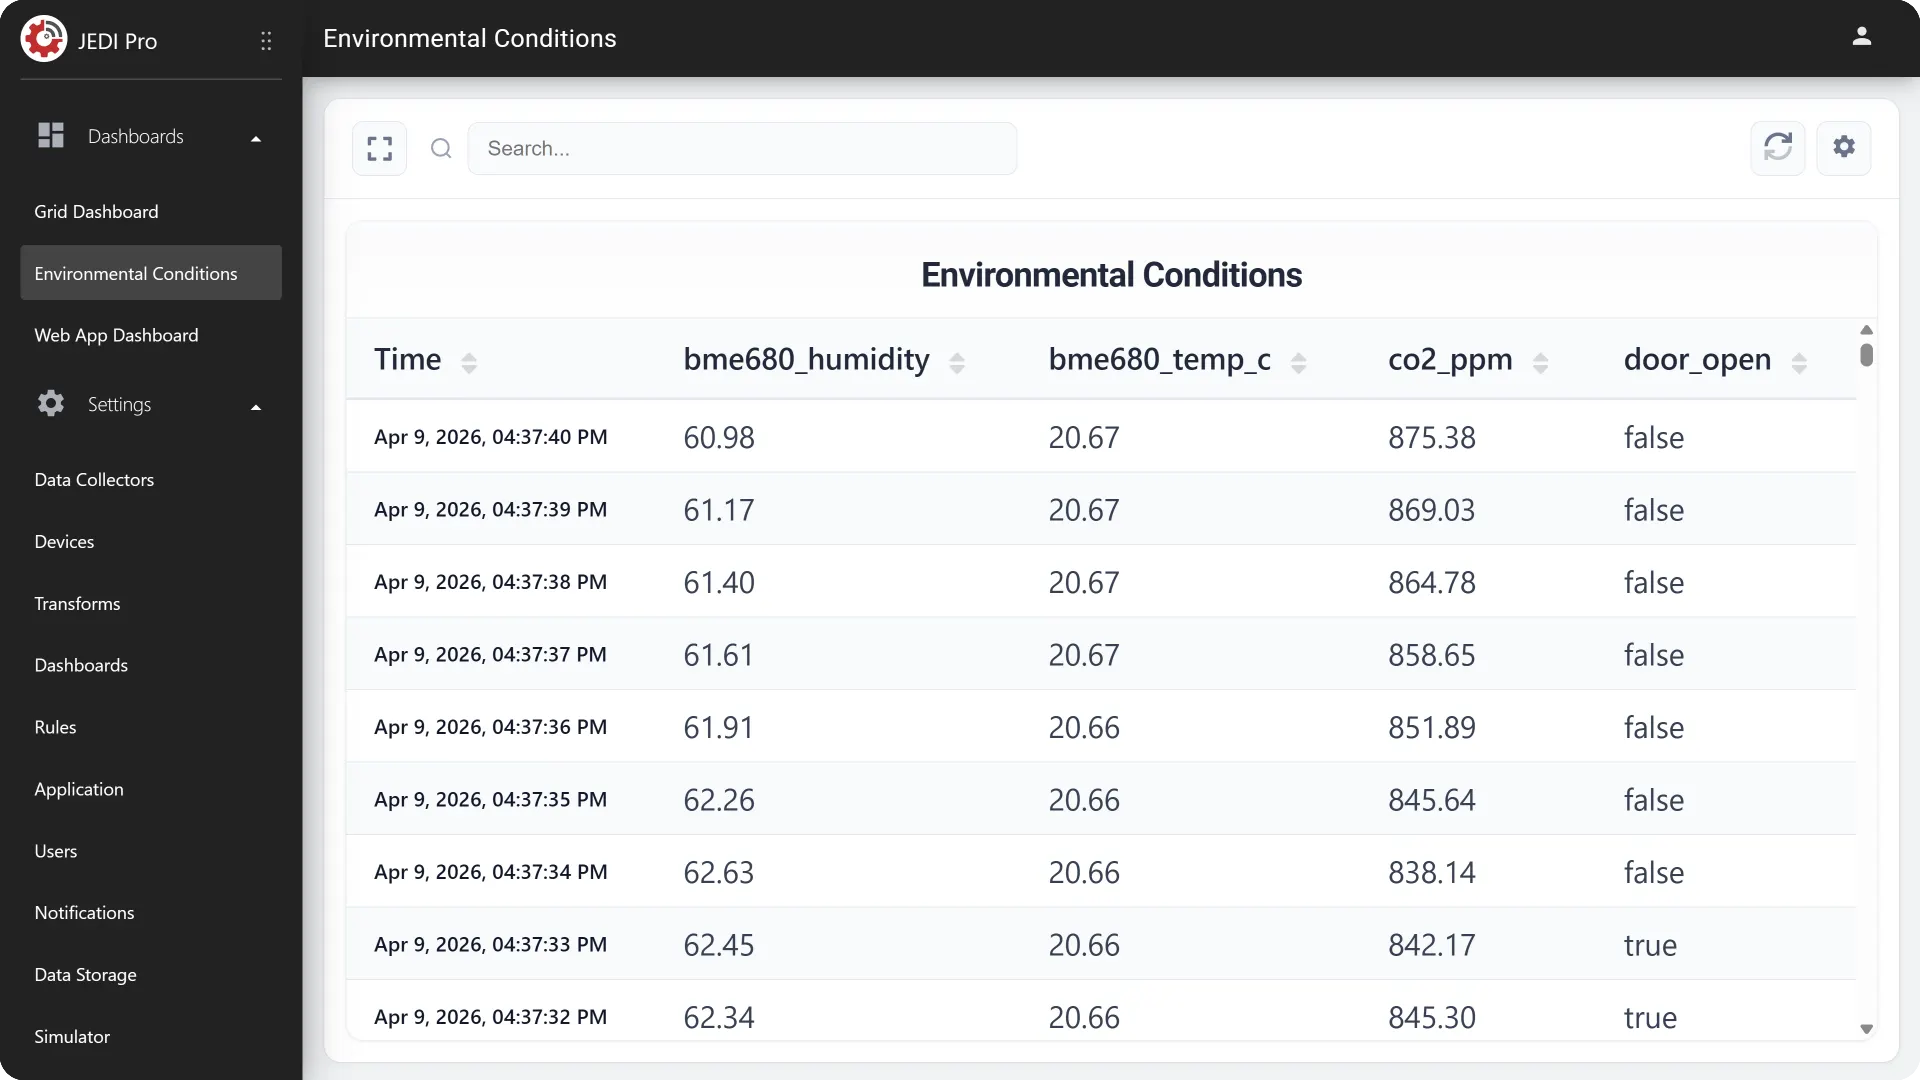
The Table Dashboard's structured display complements the graphical visualizations of Grid Dashboard. It allows you to monitor real-time data from multiple devices or from a single device over a selected time range (e.g., last 30 minutes, 1 hour, etc.).
Features
- Real-Time Data Updates: Continuously updated table entries as new data is received, enabling live monitoring.
- Multi-Metric Support: Display multiple metrics within the same table for comprehensive visibility.
- Flexible Display Configurations:
- Display data from multiple Devices for comparison
- View data from a single device over a defined Time Range
Use Cases
- Anomaly Detection: Identify unusual readings, spikes, or gaps in data that may not be immediately visible in charts.
- Data Validation and Debugging: Use the table as a quick-access log of recent data to verify, troubleshoot, and ensure accuracy.
Web App Dashboard
Quickly embed existing or custom-built web apps on Web App Dashboard without requiring additional development.
Features
- Embedded Web App Display: Display local (on-device or network-hosted) or remote (cloud-based) web applications directly within the dashboard panel.
- Unified Interface: Access data, external tools, and custom applications from without switching between platforms.
- Support for Local and Remote Sources:
- Local Web Apps: Access applications running on edge devices, gateways, or internal networks
- Remote Web Apps: Integrate cloud-hosted services, APIs, or third-party platforms
- Real-Time Interaction: Interact with embedded applications in real time to monitor, control, and exploration data within the same interface.
Use Cases
- Real-Time Control Panels: Embed control interfaces for managing devices, adjusting parameters, or triggering actions directly from JEDI.
- Contextual Information Display: Enhance dashboards with additional context such as documentation, live video feeds, or environmental data services.
Need help? Contact our support team support@machinechat.io